Figures & data
Figure 1 Flow chart of the study. aSyphilis patients who were first hospitalized from December 2020 to June 2021.
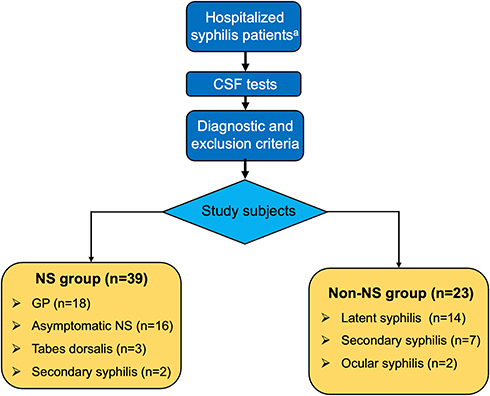
Table 1 Clinical and Laboratory Characteristics of Study Subjects
Figure 2 Venn diagram of NS versus non-NS group and GP group versus non-NS group. (A) Venn diagram for NS group and non-NS group. (B) Venn diagram for GP group and non-NS group.
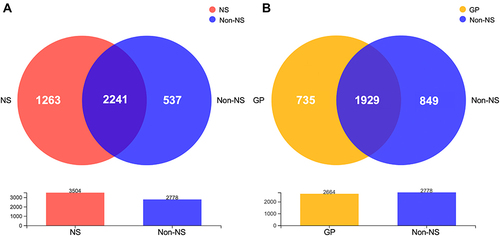
Figure 3 Community analysis of NS, GP, and non-NS groups. (A) Percentage of community abundance for all samples from NS, GP, and non-NS groups at the genus level. (B) Percentage of community abundance of NS, GP, and non-NS groups at the phylum level.
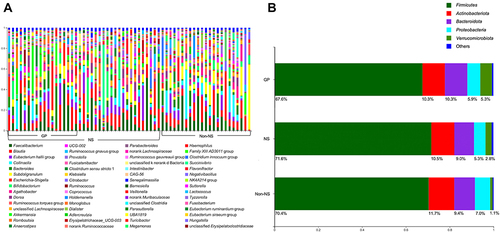
Figure 4 Wilcoxon rank-sum test bar plot of GP group and non-NS group at the phylum level. *P value <0.05.
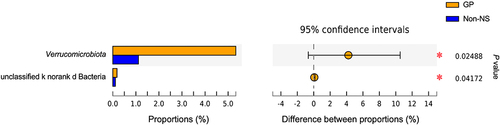
Figure 5 Wilcoxon rank-sum test bar plot of NS versus non-NS group and GP group versus non-NS group at the genus level. (A) Wilcoxon rank-sum test bar plot of NS group and non-NS group at the genus level. (B) Wilcoxon rank-sum test bar plot of GP group and non-NS group at the genus level. *P value <0.05 **P value <0.01.
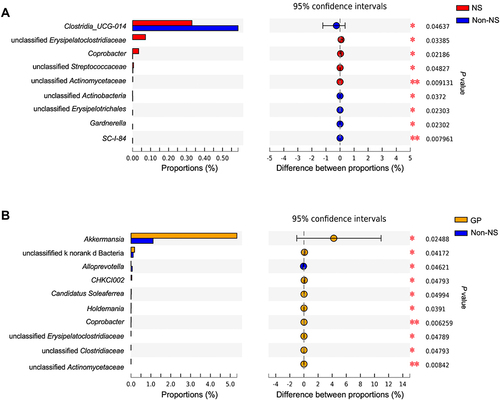
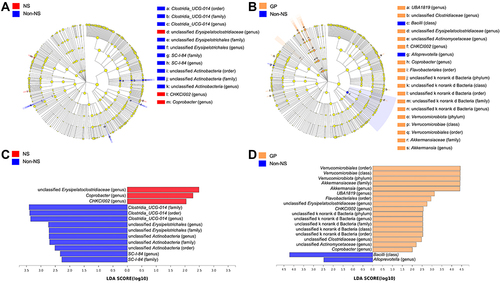
Figure 6 LEfSe analyses of NS versus non-NS group and GP group versus non-NS group. (A) Cladogram of NS group and non-NS group. (B) Cladogram of GP group and non-NS group. (C) Histogram of the LDA scores computed for features differentially abundant between NS group and non-NS group. (D) Histogram of the LDA scores computed for features differentially abundant between GP group and non-NS group.