Figures & data
Table 1 Demographic and Clinical Characteristics of Ethiopian MDR-TB Patients Recieving the Standardized LFX- (n=21) and MXF- (n=18) Based Regimen
Table 2 Overall and Final One-Compartment Model for LFX (n=21) and MXF (n=18), and Covariates Included in the Model in Ethiopian MDR-TB Patients
Figure 1 Goodness-of-fit plots for the final population pharmacokinetics of LFX (A) and MXF (B): conditional weighted residuals versus time (CWRES versus IVAR) (a); conditional weighted residuals versus population predicted concentrations (CWRES versus PRED) (b); observed versus individual predicted concentrations (DV versus IPRED) (c); observed versus population predicted concentrations (DV versus PRED) (d). The red lines in the panels represent smoothed regression lines.
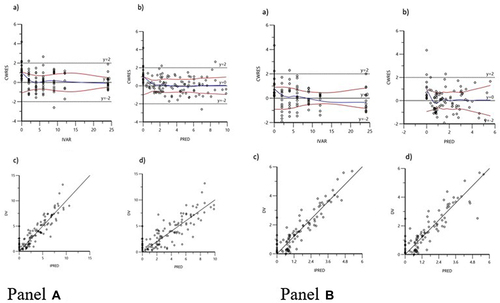
Figure 2 Visual predictive checks (a) and WRES versus Standard Normal Quantiles (b) for the final model of LFX (A) and MXF (B): red lines represent the 5th, 50th, and 95th percentiles of the observed concentrations; the shaded areas represent the 90% confidence intervals of the 5th, 50th, and 95th percentiles of the simulated concentrations, respectively; the dots represent the observed data; DV represents observed concentration; DV0, observed concentration at zero time; IVAR, time; WRES, weighted residuals.
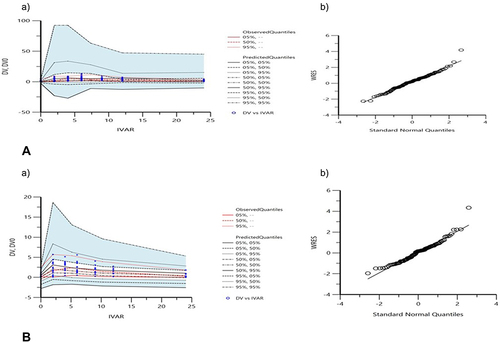
Table 3 Descriptive Summary of the Non-Compartmental Analysis of the Estimated Individual PK Parameters for the Original and Simulated Doses of LFX (n=21) and MXF (n=18) in Ethiopian MDR-TB Patients
Figure 3 Box plot for simulated Cmax (a) and AUC0-24 (b) of LFX (A) and MXF (B): the dashed line indicates the minimum threshold for Cmax and AUC0-24.
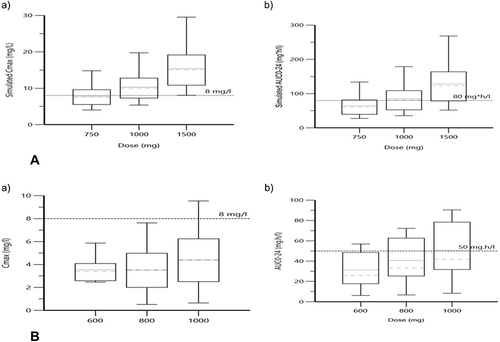
Figure 4 Percent probability of target attainment, PTA (%) for the maximal mycobacterial kill (AUC0-24/MIC ≥146) (A) and resistance suppression (AUC0-24/MIC ≥360) (B) of the simulated doses of LFX (750 mg, 1000 mg, and 1500 mg) against the assumed MIC values in Ethiopian MDR-TB patients (n=21).
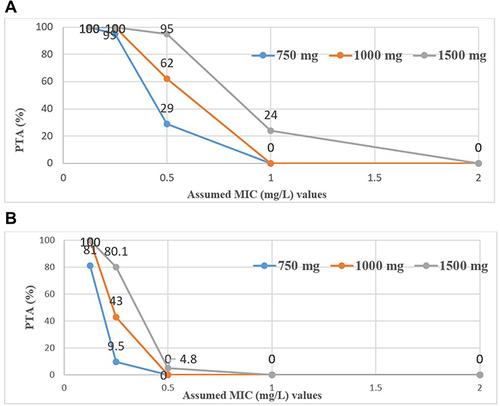
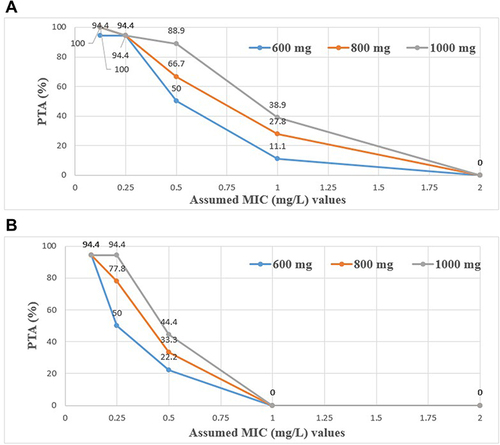
Figure 5 Percent probability of target attainment, PTA (%) for the maximal mycobacterial kill (AUC0-24/MIC≥53) (A) and resistance suppression (AUC0-24/MIC ≥100) (B) of the simulated doses of MXF (600 mg, 800 mg, 1000 mg) against the assumed MIC values in Ethiopian MDR-TB patients (n=18).