
Figures & data
Figure 1 (A) Comparison of total anti-SARS-CoV-2 antibodies level between patients after Pfizer and AstraZeneca vaccination. The data are presented as median (minimum - maximum). (B) Comparison of total anti-SARS-CoV-2 antibodies level in groups of women and men after Pfizer and AstraZeneca vaccination. The data are presented as median (minimum - maximum). (C) Comparison of total anti-SARS-CoV-2 antibodies level in groups of patients before and after the age of 50 after Pfizer and AstraZeneca vaccination. The data are presented as median (minimum - maximum). (D) Comparison of total anti-SARS-CoV-2 antibodies level in groups of patients with normal and increased BMI after Pfizer and AstraZeneca vaccination. The data are presented as median (minimum - maximum). (E) Comparison of total anti-SARS-CoV-2 antibodies level in groups of patients with and no post-vaccination symptoms after Pfizer and AstraZeneca vaccination. The data are presented as median (minimum - maximum). (F) Comparison of total anti-SARS-CoV-2 antibodies level in groups of patients with and without history of COVID 19 after Pfizer and AstraZeneca vaccination. The data are presented as median (minimum - maximum). (G) Comparison of total anti-SARS-CoV-2 antibodies level in groups of patients with and without coexisting diseases after Pfizer and AstraZeneca vaccination. The data are presented as median (minimum - maximum).
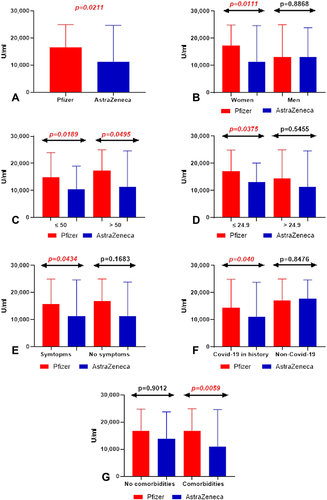
Figure 2 Heat map of correlation of total anti-SARS-CoV2 antibodies in patients after Pfizer vaccination with chosen clinical parameters.
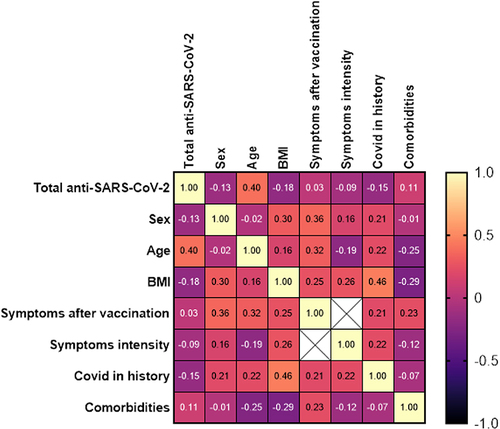
Figure 3 Heat map of correlation of total anti-SARS-CoV2 antibodies after AstraZeneca vaccination with chosen clinical parameters.
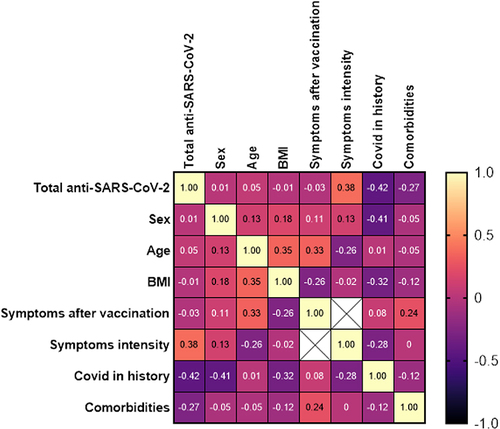
Table 1 Characteristics of Study Group
Table 2 Comparisions of Results Anti-SARS-CoV-2S Antibodies Concentration in Both Group of Residents with p value
Table 3 Multiple Regression Analysis of the Level of Anti-SARS-CoV-2S Antibodies