
Figures & data
Figure 1 Monthly distribution of the number of COVID-19 patients hospitalized in the ICU (Timișoara, Romania, October 2020–May 2021). (A) Percentage of the total number of cases with unfavorable/favorable outcome; (B) percentage of the total number of cases with infected/ uninfected status.
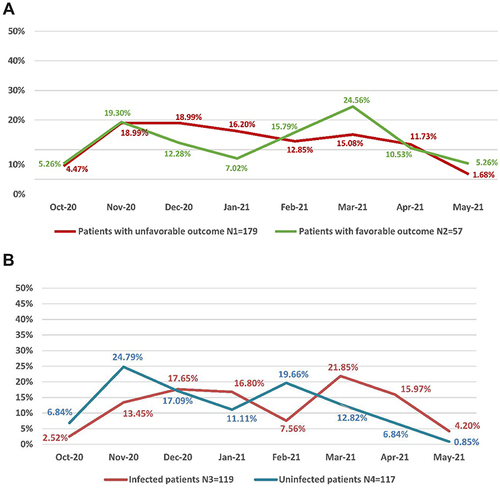
Table 1 Univariate Analysis of Factors Associated with Unfavorable Outcome in COVID-19 Patients Hospitalized in the ICU (Timișoara, Romania, October 2020–May 2021)
Table 2 Univariate Analysis of Factors Associated with Superinfection in COVID-19 Patients Hospitalized in the ICU (Timișoara, Romania, October 2020–May 2021)
Table 3 Distribution of Microbial Strains and Main Resistance Phenotypes Isolated from the Biological Samples Drawn from Infected COVID-19 Patients Hospitalized in the ICU (Timișoara, Romania, October 2020–May 2021)