Figures & data
Table 1 Clinical Features, STs, Gene Identifications and Flanking Fragment Identifications Among 41 CRKP Isolates
Figure 1 PFGE patterns and STs among 41 clinical CRKP isolates Each PFGE clade is defined based on the similarity and indicated by a black line. The strain number and MLST types are included along each PFGE lane. The red arrow indicates a primary branch that contains a number of isolates with close genetic relationship.
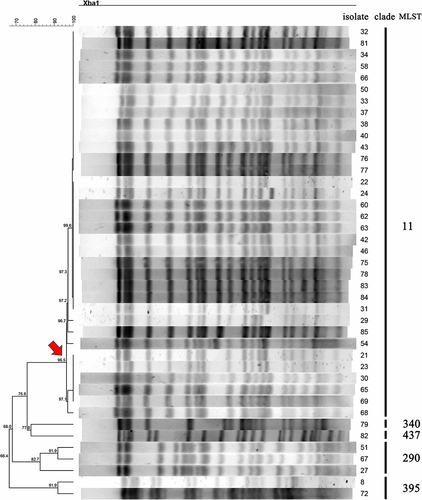
Figure 2 Comparison of blaKPC-2 carrying plasmids Linear comparison of gene contents of seven blaKPC-2 carrying IncR-IncF33:A-:B- plasmids. The ORF regions of blaKPC-2 genes are emphasized in red and other genes are shown in yellow. The pHN7A8 and pKPC-LK30 module regions are represented by green and red boxes. Detailed descriptions of the blaKPC-2 genetic backgrounds of KP21 plasmid 1 and KP29 plasmid 2 are shown in the red box at the bottom of the figure. Blue and red shadings indicate nucleotide identities among strains.
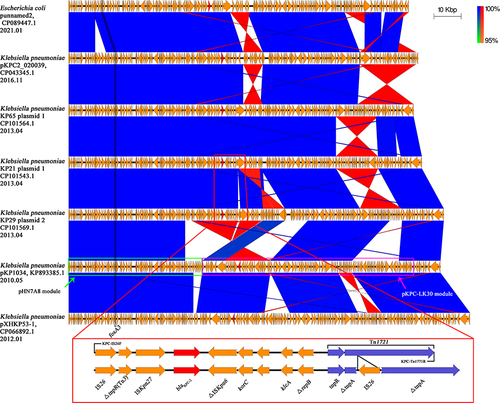
Figure 3 PCR-RFLP profiles of genetic background of blaKPC-2 Restriction endonucleases used to digest the PCR products of blaKPC-2 franking fragments are listed in the parentheses. The predicted sizes of digested fragments are marked beside the bands. Invisible predicted bands were marked with asterisks. M, DL5000 DNA marker (TSINGKE, China).
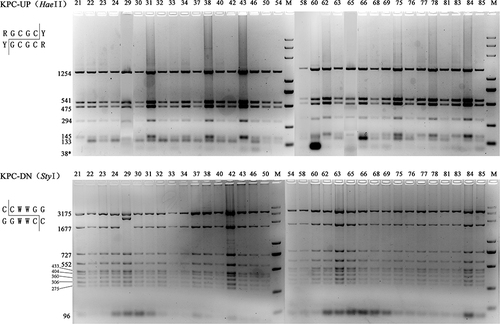
Figure 4 S1-PFGE pattern for ST11 isolates and Southern blot analysis of blaKPC-2 genes PFGE result of S1 digested plasmid DNA of ST11 isolates and the corresponding Southern hybridization using the blaKPC-2 specific probe. M, Salmonella serotype Braenderup strain H9812 was digested by XbaI.
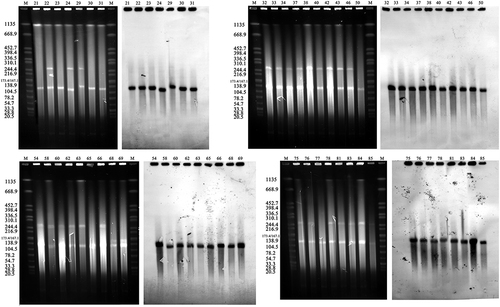
Table 2 Copy Number Analyses of blaNDM-1 and blaKPC-2 Genes
Table 3 Polymorphism Analyses of blaNDM-1 Genetic Background in KP67 and KP72
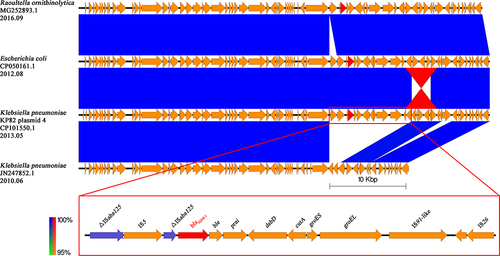
Figure 5 Comparison of the blaNDM-1 carrying KP67 plasmid 1 with other related plasmids The region spanning the blaNDM-1 on the KP67 plasmid 1 is detailed in the red box, and the repetitive elements are colored with purple. Other genes are depicted as arrows according to their direction of transcription and are shown in yellow. The blaNDM-1 and blaIMP-26 genes are emphasized by red arrows. Blue and red shadings indicate nucleotide identities among strains.
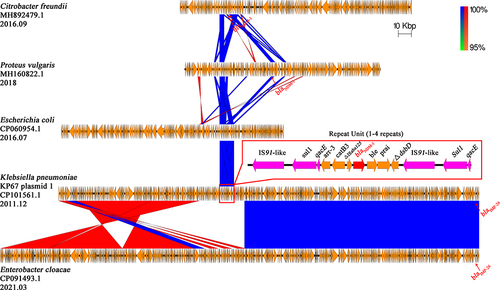
Figure 6 Comparison of the blaNDM-1 carrying KP72 plasmid 4 with other related plasmids The region spanning the blaNDM-1 on the KP72 plasmid 4 is detailed in the red box, and the repetitive elements are colored with purple. Other genes are depicted as arrows according to their direction of transcription and are shown in yellow. The blaNDM-1 and blaKPC-2 genes are emphasized by red arrows. Blue and red shadings indicate nucleotide identities among strains.
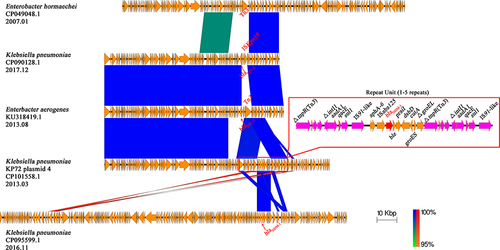
Figure 7 Comparison of the blaNDM-1 carrying KP82 plasmid 4 with other related plasmids The region spanning the blaNDM-1 on the KP82 plasmid 4 is detailed in the red box. The blaNDM-1 genes are emphasized in red. Other genes are depicted as arrows according to their direction of transcription and are shown in yellow. Blue and red shadings indicate nucleotide identities among strains.