
Figures & data
Table 1 Demographic Data of 12 Patients with Culturable NP Samples
Figure 1 CONSORT flow diagram of the pilot study.
Note: Adapted from Schulz KF, Altman DG, Moher D, for the CONSORT Group. CONSORT 2010 Statement: Updated Guidelines for Reporting Parallel Group Randomised Trials. PLoS Med. 2010;7(3): e1000251. Copyright: © 2010 Schulz et al. Creative Commons Attribution License.Citation20
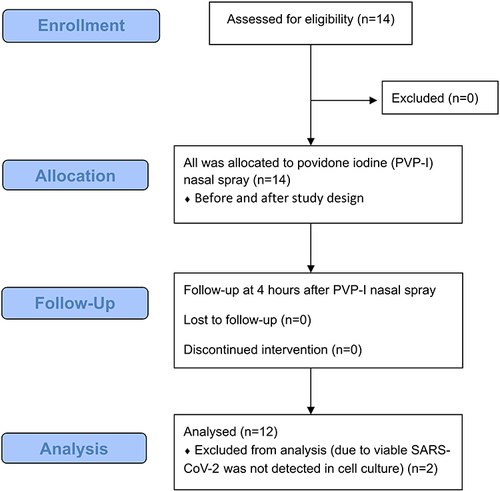
Table 2 Cycle Threshold (Ct) Values for Culturable NP Samples
Table 3 Viral Titers for Culturable NP Samples
Table 4 Change in Viral Titers After 3 Minutes and 4 Hours Exposure to PVP-I as Compared to the Baseline Value from Left NP Specimens