Figures & data
Table 1 Comparison of Clinical Characteristics of Patients Harboring CRE and CSE Isolates
Figure 1 Timelines of 52 CRE isolates containing carbapenemases from different wards during 2013 to 2017.
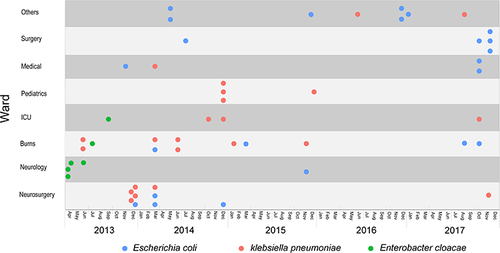
Figure 2 Core genome phylogenetic tree for all CRE isolates according to ARG and plasmid type. (A), E. coli (B), K. pneumoniae and (C), E. cloacae. Colors illustrated lineages, years, source, wards, ST types and carbapenemases, respectively. Red-filled squares indicate possession of the indicated ARG and blue-filled squares indicated plasmid Inc type.
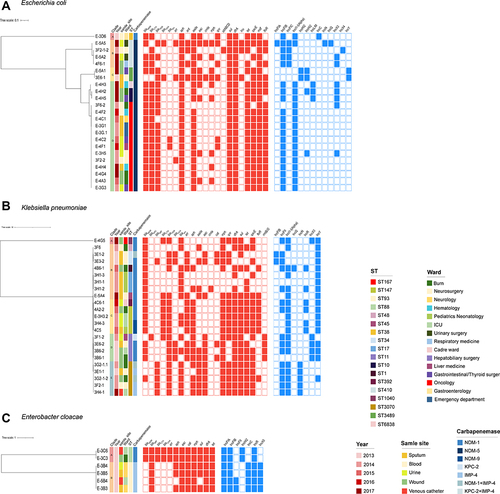
Table 2 Results of Multivariate Analysis of CRE Patients
Table 3 Antimicrobial Susceptibility of Patient CRE Isolates
Figure 3 Core SNP differences between isolates grouped by ST. Isolates listed close to each other were identical at the core genome level. Black lines, the number of SNPs differences between isolates. Color of font and background represent the wards and time that the isolate was collected, respectively.
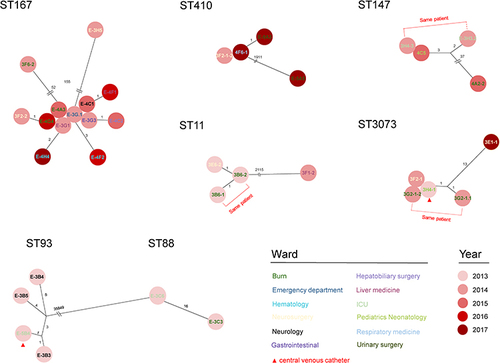
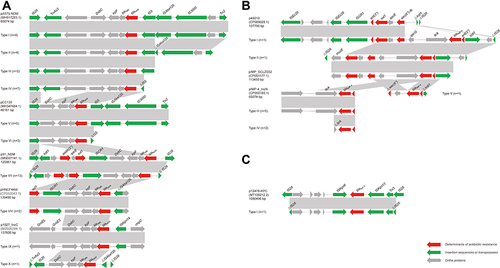
Figure 4 Genetic environments of Carbapenem resistance genes. (A) blaNDM (B), blaIMP and (C) blaKPC. Arrows, direction of transcription and genes are grouped by colour. Regions of ≥99.0% nucleotide sequence identity are shaded grey. Δ, truncated gene.