Figures & data
Table 1 Clinical Information of Samples
Figure 1 Data quality control and differentially expressed RNA screening. (A) Box plot shows that the data of each sample are distributed at the same level after uniformization, which is comparable. (B) PCA analysis shows the two groups could be clearly distinguished, and there were no outlier samples. (C) The histogram shows the upregulated (red) and downregulated (blue) genes screened under the conditions of FC≥2 and FDR<0.05, the abscissa is the number of differentially expressed RNA, and the ordinate is the grouping. (D) Volcano plot shows differentiating up-regulated (red) and down-regulated (blue) genes, as well as undifferentiated genes (black), with the abscissa being the average expression and the ordinate being log2FC.
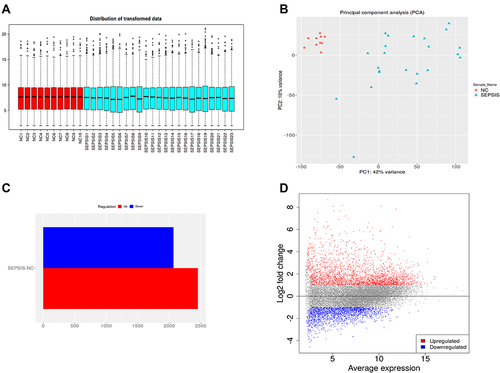
Figure 2 Screening of active targets of Panax Ginseng for antisepsis. (A) Venn diagram shows that blue represent the 103 active targets of Panax Ginseng, pink is the 4347 differentially expressed RNA of sepsis, and 27 intersecting targets in the middle are potential active targets for Panax Ginseng in the treatment of sepsis. (B) The □ on the right of the ingredient-target network represent 27 intersection targets, the ○ on the left represent the 20 active ingredients of Panax Ginseng, and the lines represent the interaction of ingredients with targets.
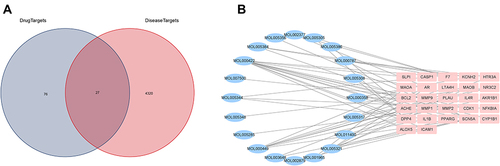
Figure 3 Analysis of intersection targets. (A) PPI network shows that the intersection targets are closely connected, IL1B, ALOX5, IL4R, CDK1, NFKBIA, etc. are located in the center of the network. (B) Heat map shows that AR, NR3C2, BCL2, DPP4, etc. have low expression in sepsis group, and IL1B, ALOX5, BCL2, IL4R, etc. have high expression in sepsis group. (C) GO annotation shows that the intersection targets are mainly involved in biological processes such as female pregnancy, cellular response to chemical stress, neurotransmitter catabolic process, multi-multicellular organism process, response to drug, negative regulation of ion transport, etc.
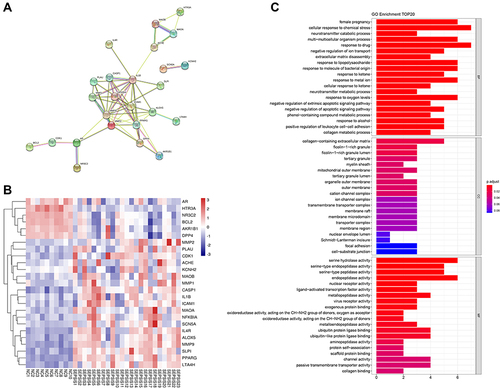
Table 2 Active Ingredients and Targets of Panax Ginseng
Figure 4 Meta-analysis. (A–D), Meta-analysis of IL1B, ALOX5, BCL2 and IL4R based on the datasets GSE54514, GSE63042 and GSE95233 show that the expression of core genes were high in sepsis survivor group and low in sepsis non-survivor group, with a statistically significant difference (P < 0.05).
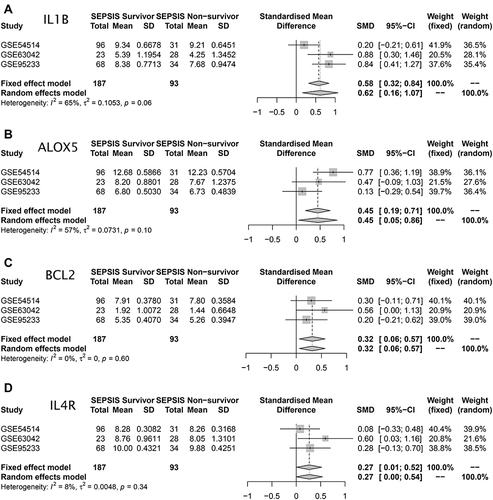
Figure 5 Single Cell RNA-Seq. (A–C) Marker gene identification. PTPRC is an immune cell marker, CD14 is a macrophage marker, CD3E is a natural killer cell and T cell marker, CD79A is a B cell marker. (D) 9 types of cell populations were obtained by marker gene identification, of which 3 and 5 represent macrophages, 4 represent natural killer cells, 1, 2, 6 and 8 represent T cells, 7 represent B cells, and 9 represent platelets.
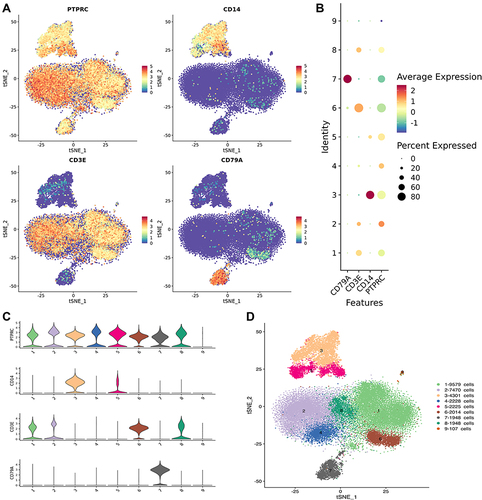
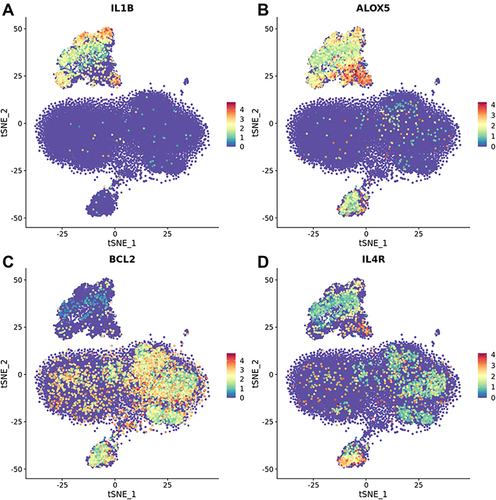
Figure 6 Cell line localization analysis of target genes. (A–D) IL1B is mainly located in 3 and 5 cell groups, that is, macrophage cell lines; ALOX5 is mainly located in 3, 5 and 7 cell groups, namely macrophages and B cell lines; BCL2 is mainly located in the 1, 2, 4, 6, 7 and 8 cell groups, that is, natural killer cells, T cells, B cell lines; IL4R is widely distributed across all immune cells.