
Figures & data
Table 1 Analysis of Basic Demographic Characteristics of Rifampicin-Resistant and Potentially RRTB Patients
Figure 1 Trend of rifampicin-resistance rates in Zhejiang Province from 2015 to 2019. (A). Shows the trend of rifampicin resistance rates in patients receiving initial treatment; (B). Shows the trend of rifampicin resistance rates in retreated patients.
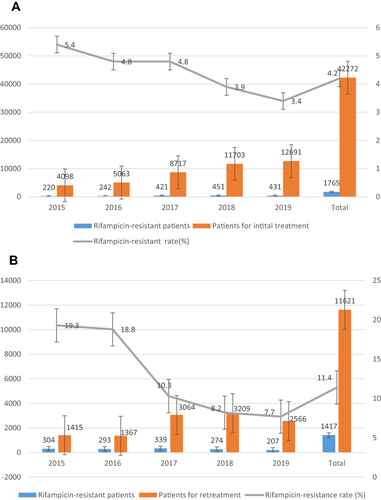
Figure 2 Geospatial distribution of 5-year overall rifampicin resistance rates in 11 cities in Zhejiang Province. The map data of cities in Zhejiang were obtained from the aliyun website (http://datav.aliyun.com/portal/school/atlas/area_selector). The map in this article is used only for data representation and does not represent a real administrative map.
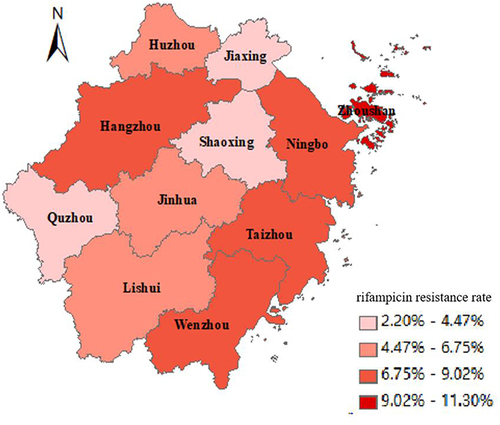
Figure 3 Epidemiological trend of rifampicin resistance rates in various cities in Zhejiang Province between 2015 and 2019.
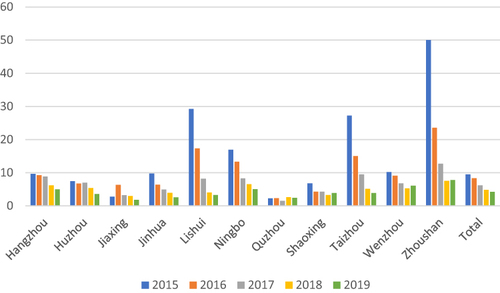
Table 2 Analysis of Rifampicin Resistance Rate Using Different Detection Methods in Zhejiang Province from 2015 to 2019
Table 3 Co-Resistance Analysis of RFP and OFX in Zhejiang Province from 2015 to 2019