Figures & data
Table 1 Antimicrobial Susceptibility of K. pneumoniae Isolates
Figure 1 Distribution of antibiotic resistance genes, plasmids and STs of all strains. Colors represent different clades. Red represents subclade 1, blue represents subclade 2, and purple represents subclade 3. The antique white squares represent corresponding ARGs or replicons.
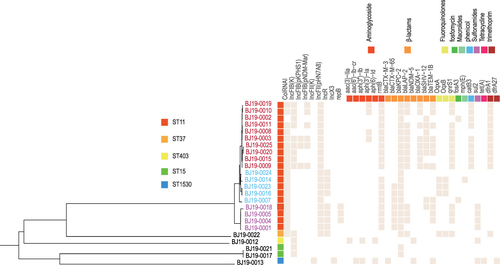
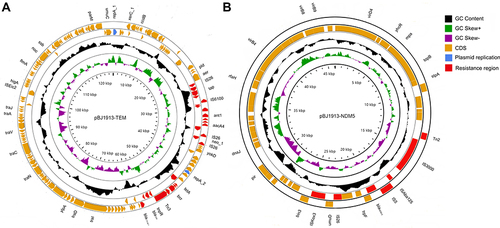
Figure 2 The genome circle map of plasmids pBJ1913-TEM (A) and pBJ1913-NDM5 (B) carried by strain BJ19-0013. The blue color in the outer circle represents the plasmid replicon protein, the red color represents the drug resistance gene region, and the Orange color represents the protein coding region. The inner-circle indicates the positive and negative GC skew of the plasmid in green and purple, respectively.