Figures & data
Figure 1 Flow chart for patients’ enrollment.
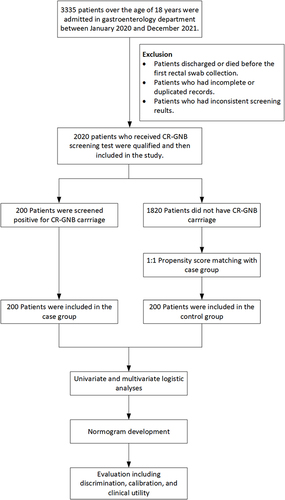
Table 1 Demographic and Clinical Characteristics of Patients Colonized with CR-GNB and Matched Controls
Table 2 Univariate and Multivariate Analysis of Risk Factors Related to CR-GNB Colonization
Figure 2 Selection of demographic and clinical features using LASSO binary logistic regression. (A) In the LASSO model, an optimal parameter (lambda) was selected using five-fold cross-validation based on minimum criteria. An image of the partial likelihood deviance (binomial deviance) curve was plotted against log(lambda). Based on the minimum criteria as well as 1 SE from the minimum criteria, dots were drawn on the vertical axis corresponding to the optimal values. (B) LASSO coefficient profiles of the 40 features. A coefficient profile plot was produced against the log (Lamda) sequence. Vertical line was drawn at the value selected using fivefold cross-validation, where optimal lamda resulted in ten features with nonzero coefficients.
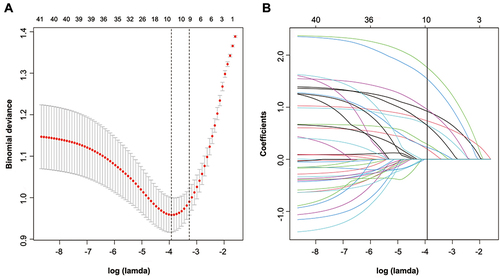
Figure 3 Nomogram to predict the probability of CR-GNB carrier status for patients in GED upon admission.
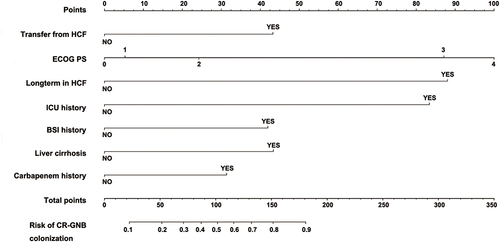
Figure 4 The example of how the predictive nomogram can be used.
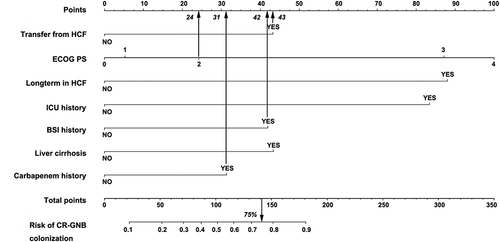
Figure 5 ROC curves for validating the discrimination power of the nomogram. ((A) training group; (B) bootstrapping group).
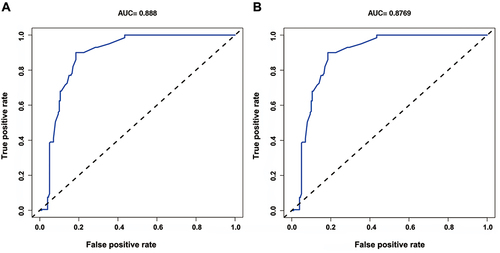
Figure 6 An analysis of the calibration curves for the CR-GNB colonization nomogram prediction in the cohort. Predicted risk of CR-GNB rectal colonization is shown on the x-axis. On the y-axis, you can see the actual CR-GNB colonizations that have been diagnosed. As depicted in the diagram, the diagonal dotted line represents the ideal model’s prediction. Nomogram performance is represented by the solid line, with a closer fit to the diagonal dotted line representing a better prediction.
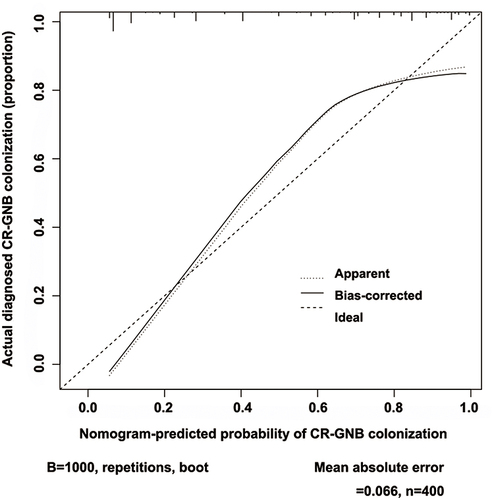
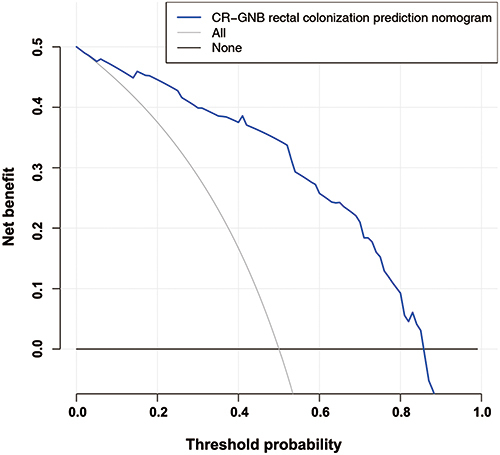
Figure 7 Analysis of the nonadherence nomogram’s decision curve. Net benefit is measured on the y-axis. In the dotted line, you can see the rectal colonization risk nomogram for CR-GNB. In this graph, the thin solid line indicates that all patients have been colonized by CR-GNB. The thick solid line represents the assumption that no CR-GNB colonization has occurred in any patient. Based on the decision curve, if the patient’s threshold probability was between 8% and 86%, using this model to predict rectal CR-GNB colonization would result in a greater net benefit for the patient.