
Figures & data
Table 1 Primer Sequences Used in This Study
Figure 1 The value of biofilm formation of strains from different sources.
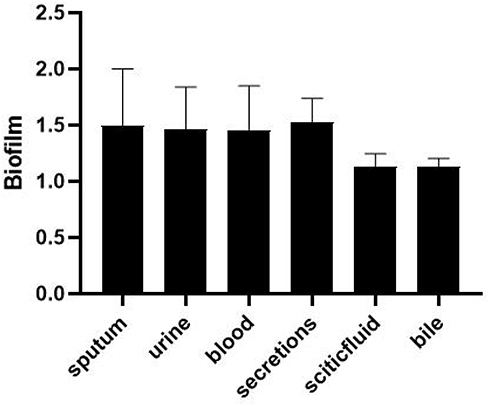
Table 2 Distribution of the Lowest Inhibitory Concentrations of 96 Strains of Klebsiella Pneumoniae to 16 Antibiotics
Table 3 Resistance Rates of hvKP Vs cKP, n=96
Table 4 Distribution of Virulence Genes in cKP Strains and hvKP Strains, n=96
Figure 2 Agarose gel electrophoresis of ESBLs genes and virulence factors.
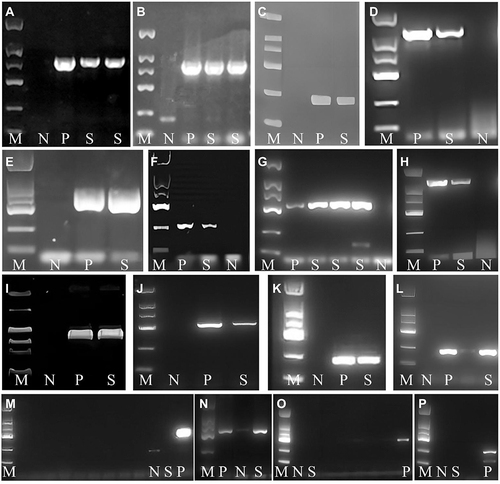
Table 5 Distribution of ESBLs Genes in ESBL-Positive cKP Strains and hvKP Strains, n=54
Table 6 Correlation of hvKP Strains with ESBL-Producing Strains
Table 7 Statistics of the Relationship Between the Genes Carrying Different ESBLs and Biofilm Formation
Figure 3 The results of double-disc synergy test (DDST) and modified carbapenem inactivation method (mCIM).
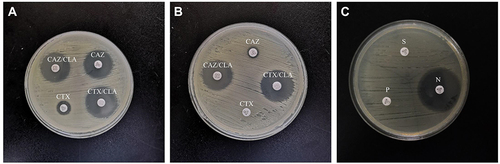
Table 8 Statistics on the Relationship Between Biofilm Formation Level and Drug Resistance