
Figures & data
Figure 1 The flowchart of patients according to inclusion and exclusion criteria.
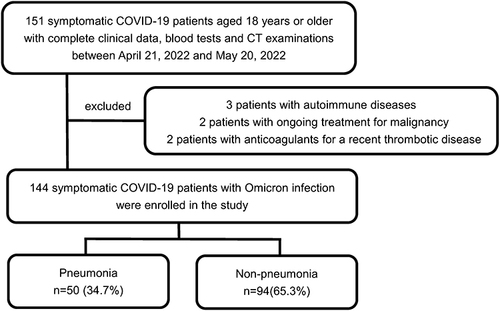
Table 1 Clinical Characteristics of Symptomatic COVID-19 Patients Infected by SARS-CoV-2 Omicron Variant
Figure 2 CT images in pneumonia COVID-19 patients infected by SARS-CoV-2 Omicron variant. (A–C), peripheral ground glass lesions. (D and E), scattered ground-glass lesions in both lungs. (F and G), local consolidation.(H and I), diffuse ground glass lesions in both lungs.
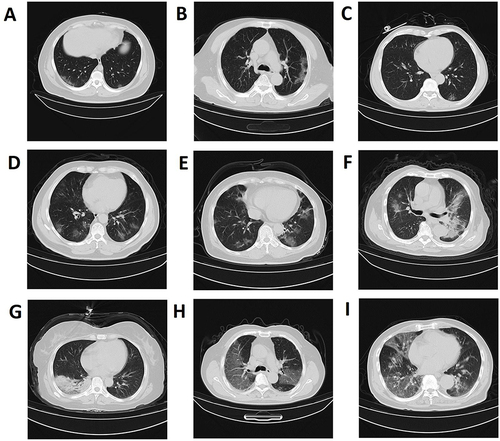
Table 2 Laboratory Findings of Symptomatic COVID-19 Patients Infected by SARS-CoV-2 Omicron Variant
Table 3 Derived Hematological Indicators of Symptomatic COVID-19 Patients Infected by SARS-CoV-2 Omicron Variant
Table 4 The Area Under the ROC Curve and Optimal Cut-Off Values for the Blood Parameters Based on the Presence of Pneumonia in Symptomatic COVID-19 Patients Infected by SARS-CoV-2 Omicron Variant
Figure 3 Receiver operating characteristic (ROC) curve for the blood parameters according to the presence of pneumonia in symptomatic COVID-19 patients infected by SARS-CoV-2 Omicron variant. (A), ROC curve for leukocytes, neutrophils, fibrinogen and D-dimer. (B), ROC curve for lymphocytes.

Table 5 The Area Under the ROC Curve and Optimal Cut-Off Values for the Derived Haematological Indicators Based on the Presence of Pneumonia in Symptomatic COVID-19 Patients Infected by SARS-CoV-2 Omicron Variant
Figure 4 Receiver operating characteristic (ROC) curve for the derived hematological indicators according to the presence of pneumonia in symptomatic COVID-19 patients infected by SARS-CoV-2 Omicron variant. (A), ROC curve for NLR, MLR, FLR and FDR. (B), ROC curve for NLR+FDR.
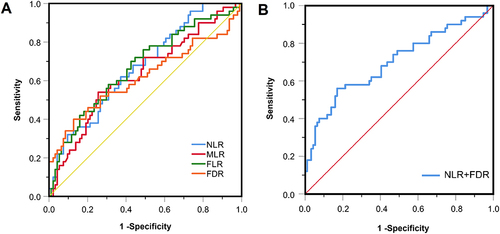
Table 6 Univariate and Multivariate Logistic Analyses for Determining Risk Factors for Pneumonia in Symptomatic COVID-19 Patients Infected by SARS-CoV-2 Omicron Variant