
Figures & data
Table 1 Demographic Characteristics of Patients
Figure 1 Flowchart of patient inclusion.
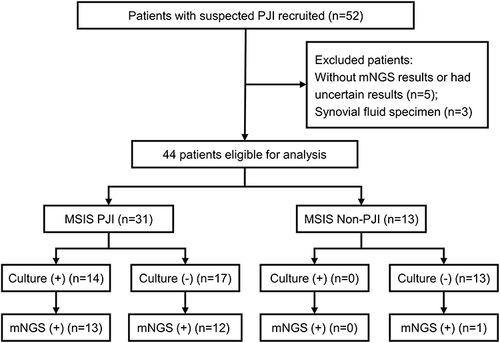
Table 2 Microbial Results of mNGS and Culture in PJI Group
Table 3 Performance of mNGS and Culture Compared to the MSIS Criteria
Table 4 Comparison of Diagnostic Efficacies Using MSIS and Culture as the Reference Standard
Figure 2 Receiver Operator Characteristic (ROC) curves of mNGS using different reference standards. (A) When culture was used as the reference standard, the Area Under Curve (AUC) of mNGS was 0.731 (95% CI: 0.654–0.897); (B) When MSIS was used as the reference, the AUC of mNGS was 0.826 (95% CI: 0.786–0.964).
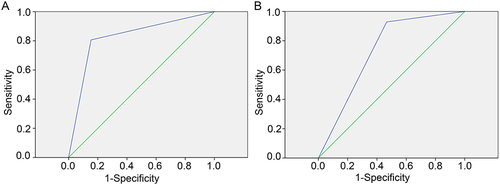
Table 5 Comparison of Antibiotic Use on the Efficacy of mNGS and Culture