
Figures & data
Table 1 Basic Characteristics of All Patents in the PJI and AF Groups
Table 2 Comparison of the Levels of All Inflammatory Biomarker Combination
Table 3 Diagnostic Value of CRP, ESR, NLR, PLR, CAR, CLR, NAR and PAR
Figure 1 Comparison of combined inflammatory biomarkers levels between the PJI group and the AF group. (A) neutrophil-to-lymphocyte ratio (NLR); (B) platelet-to-lymphocyte ratio (PLR); (C) C-reactive protein-to-albumin ratio (CAR); (D) C-reactive protein-to-lymphocyte ratio (CLR); (E) neutrophil-to-albumin ratio (NAR); (F) platelet-to-albumin ratio (PAR). ***P<0.001.
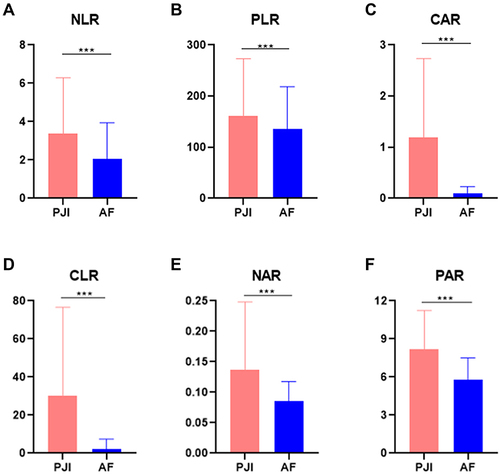
Figure 2 The ROC curves of CRP, ESR, NLR, PLR, CAR, CLR, NAR and PAR.
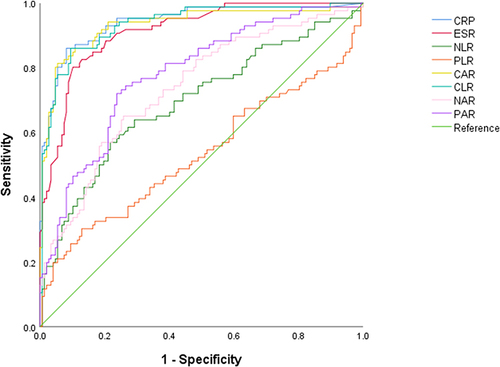
Table 4 Comparison of All Inflammatory Biomarker Combination in the Different PJI Subgroups
Table 5 Combinational Diagnostic Value of the CAR and CLR Combined with CRP and ESR for PJI
Table 6 Culture Results of Patients in the PJI Group