
Figures & data
Figure 1 (a) Workflow of the disk stacking plus micro-elution method, (b) Images of one representative isolate (upper) and the standard strain E. coli strain ATCC25922 (lower).
Abbreviations: ATM, aztreonam; CZA, ceftazidime/avibactam.
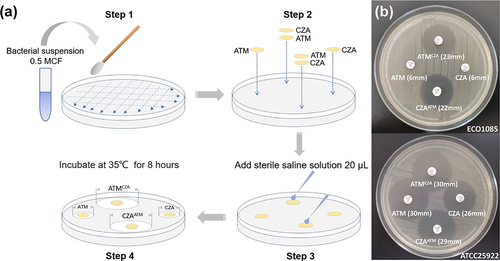
Table 1 Comparison of Results Between the DSE Method and Checkerboard Assay
Table 2 Evaluation of the Qualitative and Reproducible Performance of the DSE Method