Figures & data

Table 1 Clinical Characteristic of the Subjects
Figure 1 The comparison of PAB levels in HBV-ACLF, HBV-DCC, HBV-LC, CHB, and HCs patients. Values are presented as mean± SD. The level of PAB in patients with HBV-ACLF was significantly lower than that in patients with HBV-DCC, HBV-LC, CHB, and HCs.
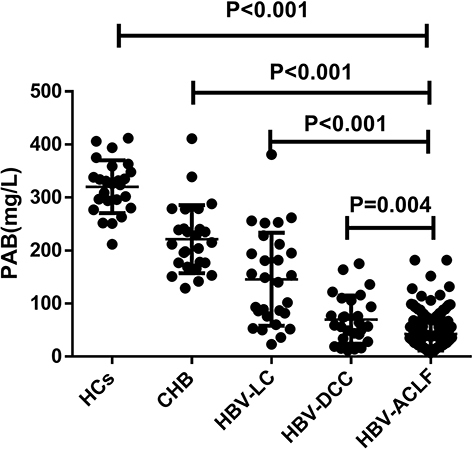
Figure 2 The serum PAB levels in non-survivor (n = 57) and survivor (n = 128) patients with HBV-ACLF.
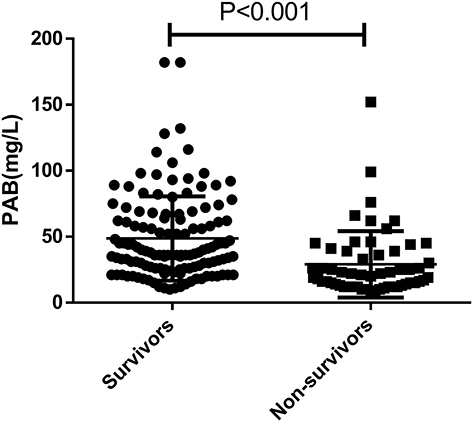
Figure 3 Correlations between serum PAB levels and liver injury parameters in patients with HBV-related liver diseases. Correlations between PAB and ALT (a), AST (b), TBIL (c), INR (d), PLT (e), MELD (f).
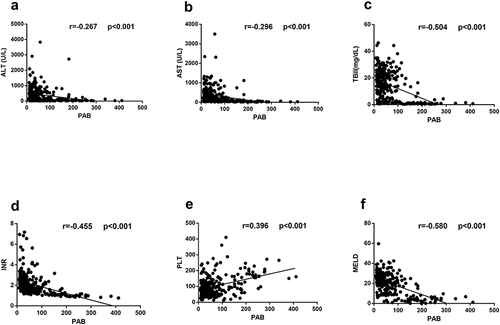
Table 2 Baseline Characteristics of the Deriving Cohort Enrolled in This Study on Admission
Table 3 Mortality According to PAB Levels
Figure 4 Using PAB on admission for predicting the prognosis of HBV‐ACLF. (a) the concentrations of PAB in Non-survivor (n = 38) and Survivor (n =82) patients in the deriving cohort. (b) ROC analysis shows the performance of PAB in distinguishing Non-survivor patients from Survivor patients in the deriving cohort.
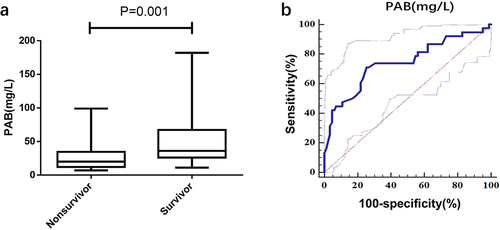
Figure 5 The correlations between HIAPP and other scores on admission in the deriving cohorts (a) HIAPP score distribution of non-survivor and survivor HBV-ACLF patients in the deriving cohorts (b) The correlations between HIAPP and MELD (c) ROC analysis shows the performance of the HIAPP, COSSH-ACLF II, CLIF-C ACLF, and MELD scores.
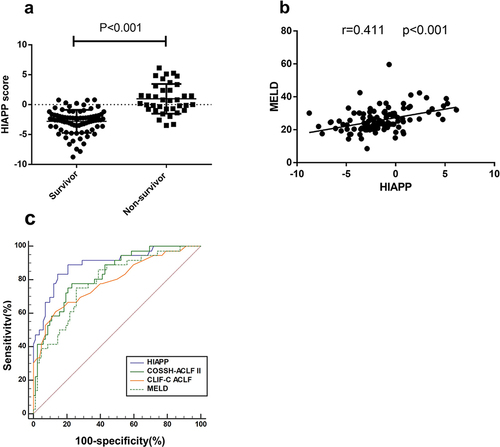
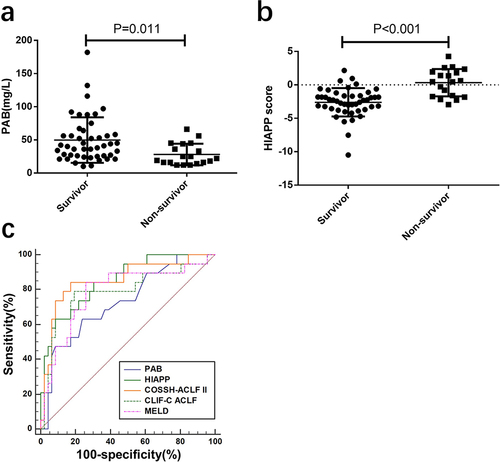
Figure 6 The performance of PAB, HIAPP, COSSH-ACLF II, CLIF-C ACLF and MELD for predicting the 30‐day mortality in the validation cohort (a) PAB level of non-survivor and survivor of HBV‐ACLF patients in the validation cohort. (b) HIAPP score of non-survivors and survivors in the validation cohort. (c) ROC analysis shows the performance of PAB, HIAPP, COSSH-ACLF II, CLIF-C ACLF, and MELD scores in the validation cohort.