
Figures & data
Figure 1 Data cleaning and analysis flowchart.
Abbreviation: N, Total number.
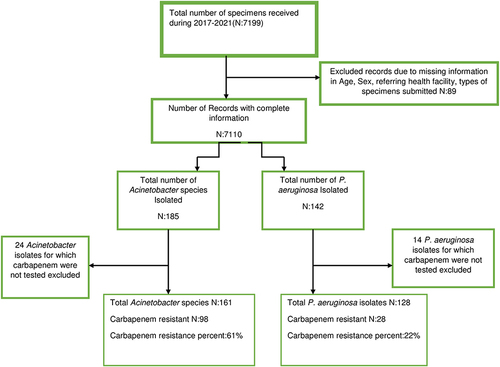
Figure 2 Carbapenem-resistant Acinetobacter species and P. aeruginosa distribution among different specimens.
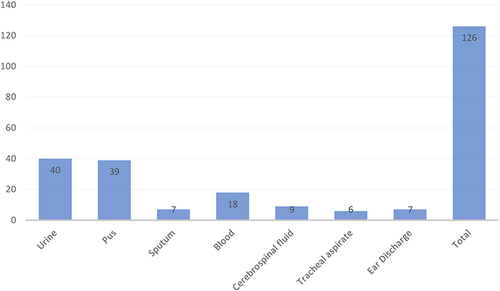
Table 1 Distribution of Carbapenem-Resistant Isolates by Patient Demography, Health Facilities, and Wards
Table 2 Overall Antimicrobial Susceptibility Profile of Acinetobacter Species Isolates During 2017–2021
Table 3 Overall Antimicrobial Susceptibility Profile of P. aeruginosa Isolates During 2017–2021
Table 4 Co-Resistance Profile of Carbapenem-Resistant Acinetobacter Species and P. aeruginosa to Other Antimicrobial Agents
Table 5 Carbapenem Resistance Trend of Acinetobacter Species and P. aeruginosa (2017–2021)