
Figures & data
Table 1 The Primers Used in This Study and Their Sequences
Figure 1 Antibiotic resistance profile of P. aeruginosa according to the type of sample.
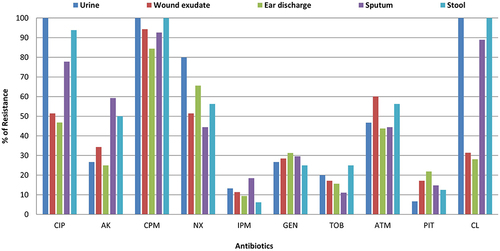
Table 2 Distribution of MDR Resistant P. aeruginosa Among Isolates Among Different Types of Infection
Table 3 Prevalence of MDR Isolates Among the Different Types of Infections
Table 4 Distribution of Quorum Sensing and Virulence Factors Regulating Genes in P. aeruginosa Isolated from Different Clinical Specimens
Table 5 Distribution of Virulence Factor Genes Among MDR and Non-MDR P. aeruginosa Isolates
Table 6 Resistance Pattern of P. aeruginosa Among Biofilm Producers and Non-Producer
Figure 2 Correlation between biofilm formation and type of resistant P. aeruginosa isolates (P > 0.001).
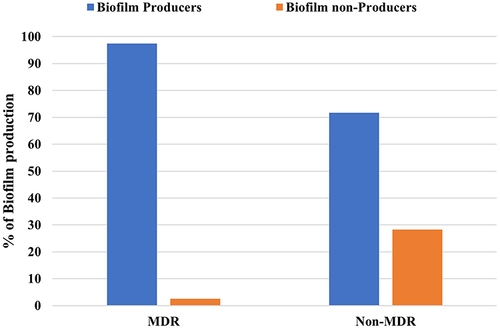
Table 7 Distribution of Virulence Genes Among P. aeruginosa Clinical Isolates Collected from Different Sources
Table 8 Resistance Pattern of Highly Virulent Biofilm Producing P. aeruginosa Harboring ≥6 Virulence Genes
Table 9 Correlation Between Different Groups of Virulent Genes of Highly Virulent Biofilm Producing P. aeruginosa and Number of Resistant Antibiotics
Table 10 Correlation Between Number of Genes and Number of Antibiotics