Figures & data
Figure 1 Timeline to summarize the case history of the patient admission, treatment, and isolate collection.
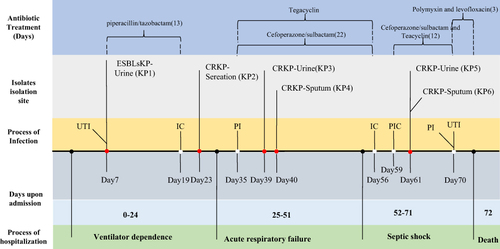
Table 1 Antimicrobial Susceptibility Test of Six Klebsiella pneumoniae Isolates
Figure 2 Determination of carbapenem resistance of the KP strains by measuring carbapenemase activity using NG-test CARBA 5 kit (A), and carbapenem resistance genes using PCR (B). C: positive control, K: KPC, O: OXA-48-like, V: VIM, I: IMP, N: NDM.
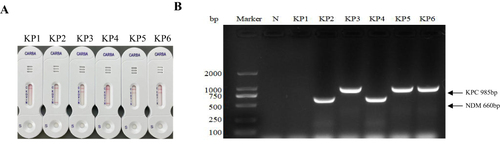
Table 2 Summary of the Genetic and Phenotypic Profiles of the Klebsiella pneumoniae Isolates
Figure 3 Images of hypermucoviscous phenotype assessed by string test.
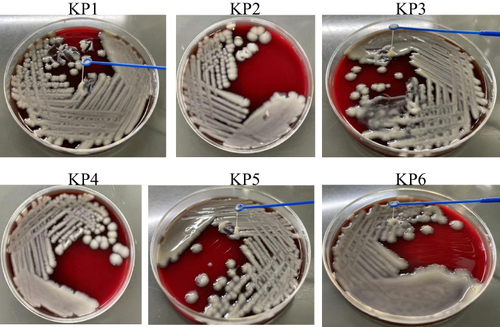
Table 3 Viable Counts (CFU/mL) and Percentage of Living Colonies in Serum Killing Assay
Figure 4 Logarithmic calculation of viable colony counts (CFU/mL) of the KP strains subjected to co-incubation with pooled healthy serum for three hours. The values were expressed in the form of mean ± error, and log 10 was used for logarithmic conversion to simplify the data.
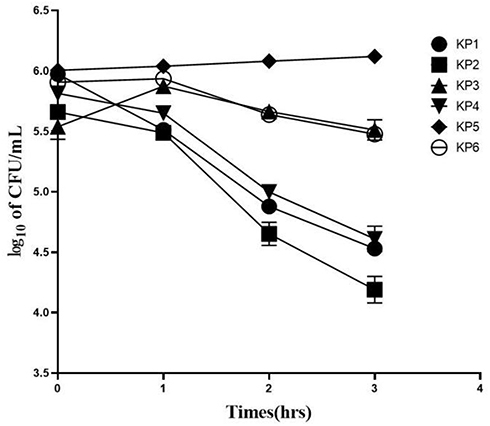
Figure 5 Capuslar serotypes, ST types, and the distribution of genetic features of the strains revealed by Whole genome sequencing (WGS). The presence and absence of the gene were represented by blue and gray squares, respectively.
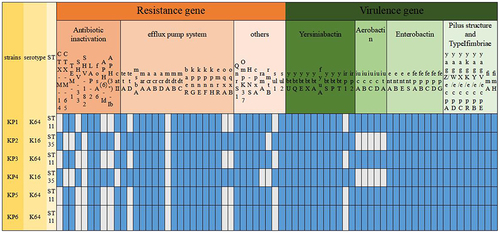
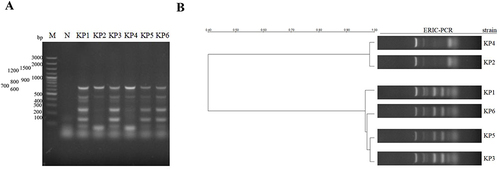
Figure 6 ERIC-PCR banding fingerprints of the KP strains (A). Lane M is the DNA molecular weight marker. The homology among the strains was calculated with the UPGMA clustering algorithm and illustrated as a dendrogram (B).