
Figures & data
Figure 1 Map of case distribution of tetanus in China. This figure illustrates, over nearly 20 years, the distribution of 6084 cases of non-neonatal Tetanus in China from the literature included in this study, in which Hebei, Guangdong, and Shandong corresponded to the largest number of cases with 637, 621, and 568, respectively. Unfortunately, data from Xinjiang, Tibet, Liaoning, Tianjin, Qinghai, Taiwan, Hong Kong, and Macao are missing.
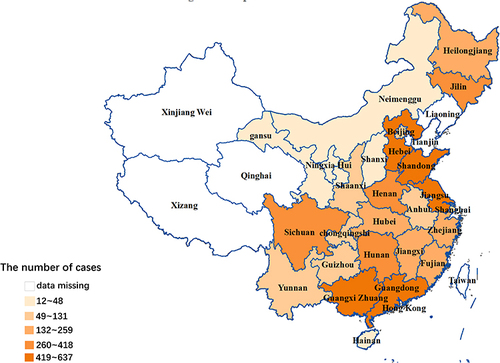
Table 1 General Information About the Cases
Table 2 Causes of Injury
Figure 2 Injury sites and proportion. In this study, 1258 cases recorded the number of injury sites. This figure illustrates the proportion of injury sites such as the lower extremities, the upper extremities, the head and neck, and the trunk. The lower extremities comprised the highest percentage, accounting for 54.35% (699/1258), followed by the upper extremities with 36.47% (469/1286). The head and neck and trunk accounted for a smaller portion, with 7.75% and 1.40%, respectively.
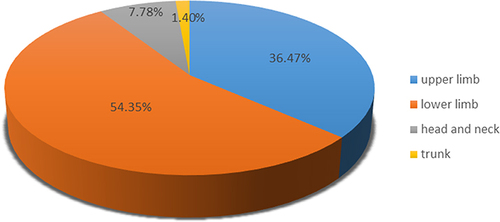
Figure 3 Wound management 24 h after injury and proportion. In this study, wound management 24 h after injury was reported in 775 cases. This figure illustrates the methods and their proportion of wound management 24 h after injury. In total, 87.74% (680/775) of patients did not deal with their wounds 24 h after injury, 9.30% of patients dealt with their wounds by themselves, and 2.96% of patients sought formal wound treatment at a hospital.
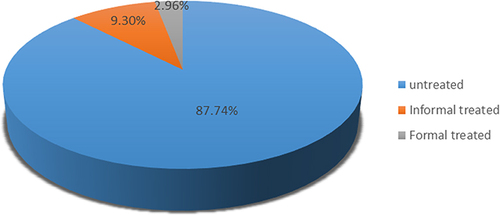
Table 3 Approach to Toxin Neutralization
Table 4 Therapies of Sedation and Spasmolysis
Figure 4 Causes of death and proportion. In this study, a total of 4305 cases featured detailed records of patient outcomes. This figure shows the causes of death and their proportion. The leading causes of death were treatment terminated by family members (24.00%), asphyxia due to persistent spasms (24.00%), respiratory failure (21.78%), autonomic dysfunction (11.56%), and others (18.67%).
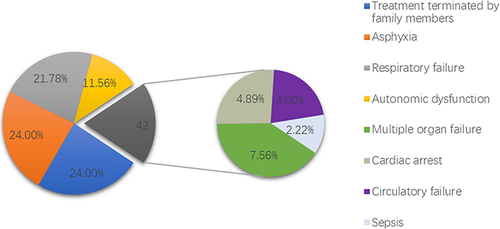
Table 5 Outcome and Tracheotomy