Figures & data
Table 1 Distribution of Acinetobacter baumannii Based on Mode of Acquisition of Infection and in Various Clinical Specimens
Table 2 Correlation Between the Clinical Diagnosis and Antibiotics Used in the Infected Patients
Figure 1 Distribution of antimicrobial resistance (AMR) pattern of 123 Acinetobacter baumannii clinical isolates.
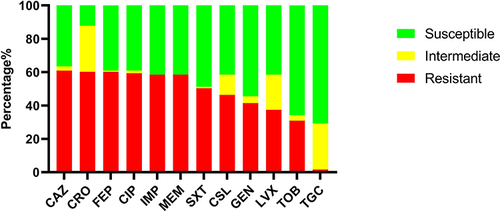
Figure 2 The presence of antimicrobial resistance genes (ARGs) of 123 Acinetobacter baumannii clinical isolates.
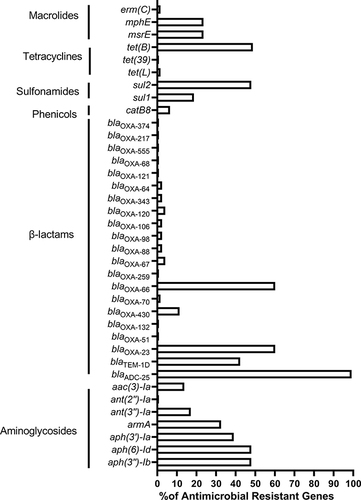
Figure 3 Multi-locus sequence typing (MLST) and minimum spanning tree (MST) population analysis of 123 Acinetobacter baumannii clinical isolates from the different clinical departments.
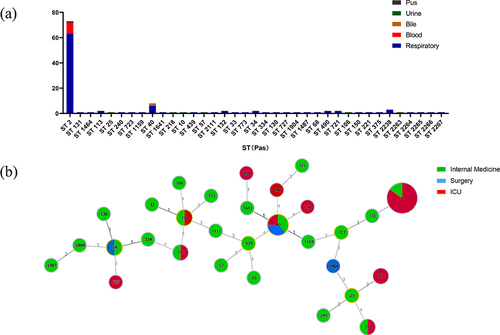
Figure 4 Comparison of antimicrobial resistance phenotypes and genotypes, STs and VFGs between isolates from different clinical departments.
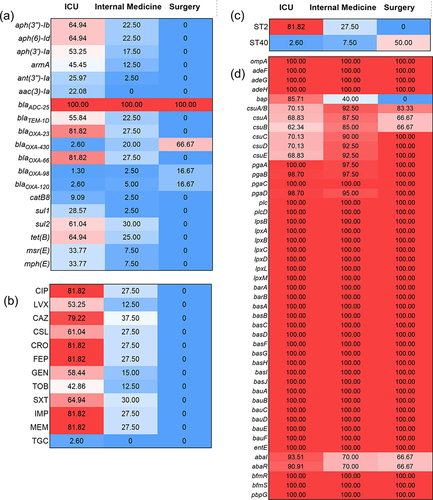
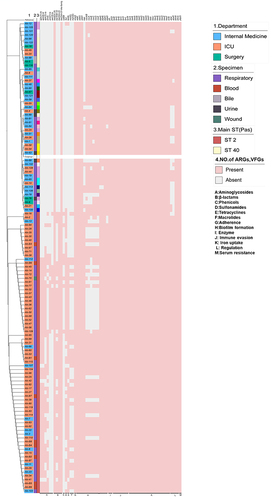
Figure 5 Phylogenetic analysis and heat map of the detection of ARGs and VFGs among the 123 Acinetobacter baumannii clinical isolates.