Figures & data
Table 1 Demographic Data for P. aeruginosa Detection Throughout the 11-Year Study Duration
Figure 1 Proportions of the various sample types from which P. aeruginosa was isolated over the 11-year study duration.
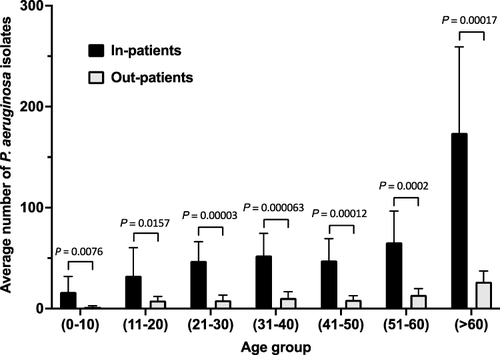
Figure 2 Distribution of P. aeruginosa isolates according to sample origin over the 11-year study duration.
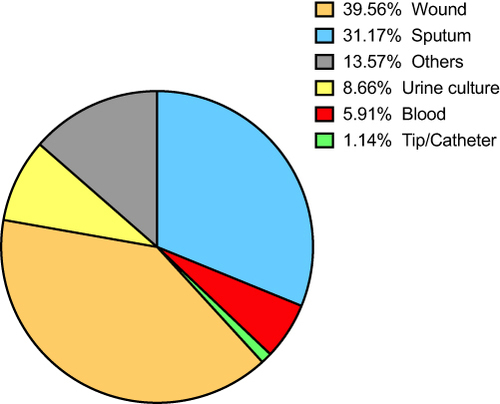
Table 2 Distribution of P. aeruginosa Isolates According to Sample Origin with Respect to Year
Figure 3 Average rates of resistance for the antibiotics tested amongst isolates of P. aeruginosa.
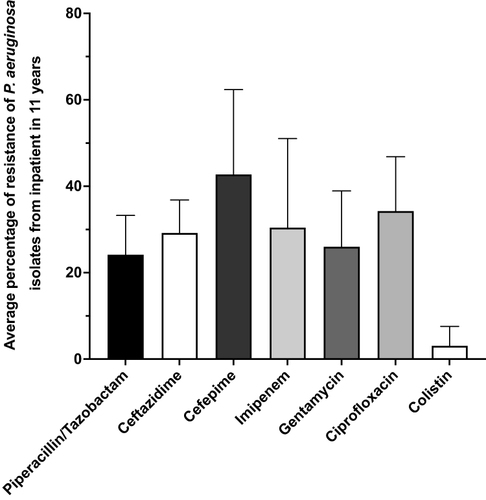
Figure 4 Average rates of resistance for the antibiotics tested with respect to in-patient or out-patient sample source.
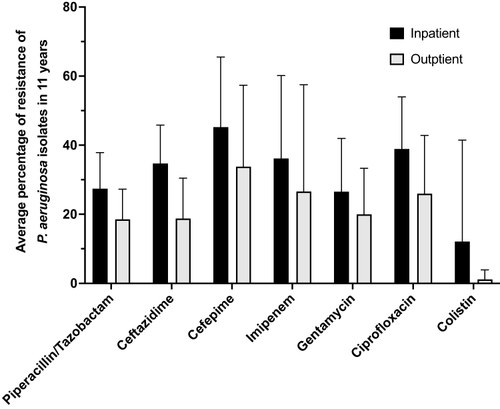
Figure 5 Schematic demonstrating the evolution of resistance to anti-microbial agents over the study period, 2011–2021.
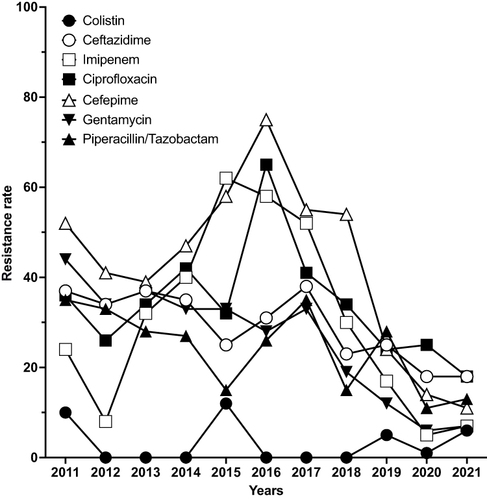
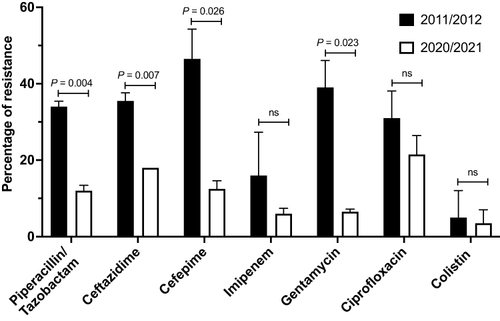
Figure 6 Antibiotic resistance rates of P. aeruginosa recognized during the initial (2011 and 2012) and final (2020 and 2021) two years of the study.