Figures & data
Table 1 Comparison of Baseline Characteristics Between Patients in Survival and Death Group
Table 2 Drug Resistance Rates of Klebsiella Pneumoniae Isolated from Different Sites to 16 Antibiotics Commonly Used in Clinical Practice
Table 3 Drug Resistance Rates of Carbapenem-Resistant Klebsiella Pneumoniae Isolated from Different Sites to 16 Antibiotics Commonly Used in Clinical Practice
Figure 1 (A) The trajectory tracking between carbapenem resistance, site of infection, and multiple drug resistance (MDR).
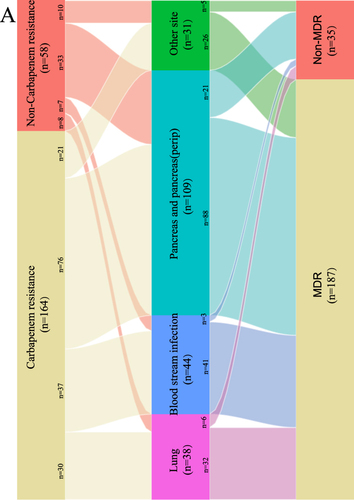
Table 4 Univariate and Multivariate Analysis of Risk Factors Associated with Carbapenem Resistance of Klebsiella Pneumoniae Infection in AP Patients
Table 5 Univariate Analysis and Multivariate Analysis of the Mortality Risk Factors Among the AP Patients with Klebsiella Pneumoniae Infection
Figure 2 Survival comparison of patients with independent risk factors (Kaplan–Meier curve). (A) Carbapenem resistance vs non-Carbapenem resistance (P = 0.009); (B)Hemorrhage vs non-Hemorrhage (P < 0.001); (C) Septic shock vs non-Septic shock (P < 0.001); (D) Age > 60 years vs ≤ 60 years (P = 0.03). (E) Creatinine >177μmol/L vs ≤177μmol/L (P < 0.001).
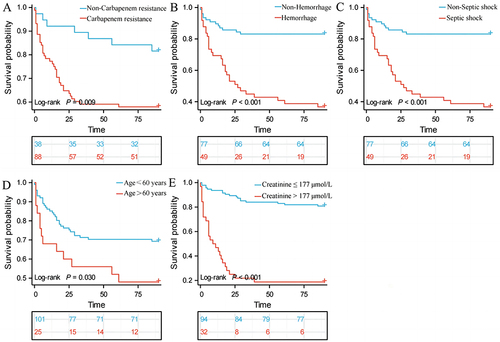
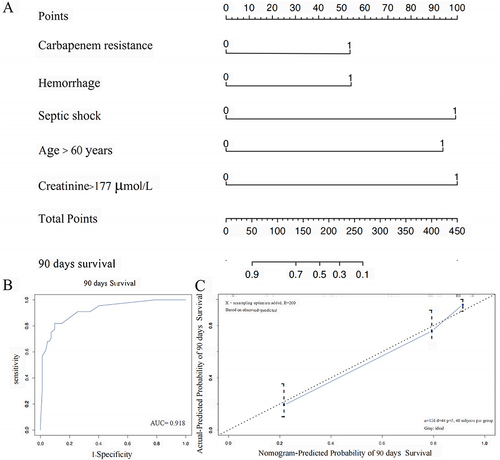
Figure 3 (A) Nomogram for predicting the mortality risk in patients with AP and KP infection. (B) ROC curve for the predictive model; (C) Validity of the predictive performance of the nomogram in estimating the probabilities of 90 days survival.