
Figures & data
Figure 1 Dynamics of HAV notification rate per 100,000 population in Bulgaria (in red) and EU/EEA (in blue), 2011–2021.
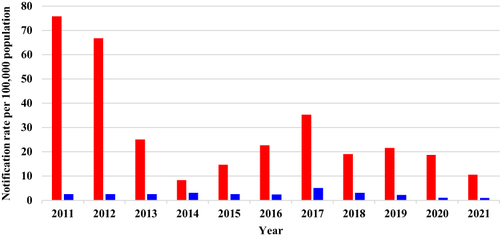
Figure 2 Flow chart showing the selection process of research participants.
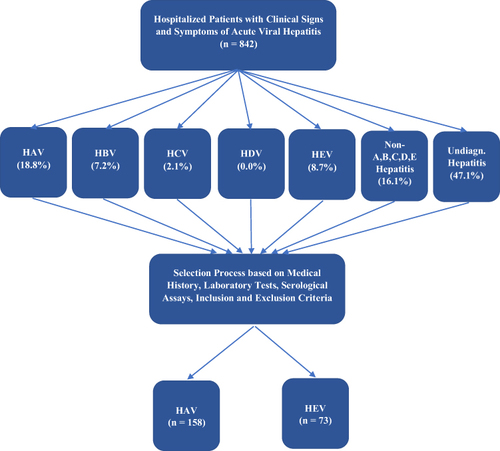
Table 1 Clinical Characteristics of Bulgarian Patients with Acute Hepatitis A Virus (HAV) Infection and Acute Hepatitis E Virus (HEV) Infection
Figure 3 The monthly incidence rates of acute HAV (in blue) and acute HEV (in red).
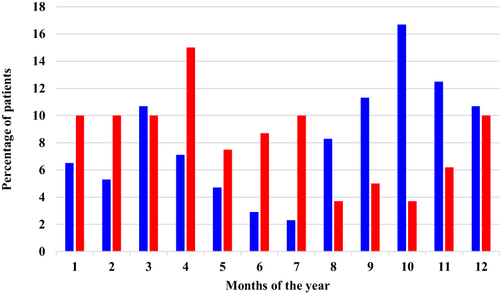
Table 2 Univariate Logistic Regression Showing the Association Between the Type of Viral Hepatitis (HAV and HEV) and Various Parameters Among Male and Female
Table 3 Multivariable Logistic Regression Showing the Relationship Between the Type of Viral Hepatitis and Some Parameters Among Male and Female
Table 4 Univariate Logistic Regression Showing the Association Between the Type of Viral Hepatitis (HAV and HEV) and Various Parameters Among Age Groups (Non-Elderly and Elderly)
Table 5 Multivariable Logistic Regression Showing the Relationship Between the Type of Viral Hepatitis and Some Parameters Among Age Groups (Non-Elderly and Elderly)