
Figures & data
Figure 1 The entry rules of study population.
Abbreviations: NTM, nontuberculous mycobacteria; PNB, p-nitrobenzoic acid; HN, high-nil (>8 IU/mL); LM, low mitogen (<0.5 IU/mL) response.
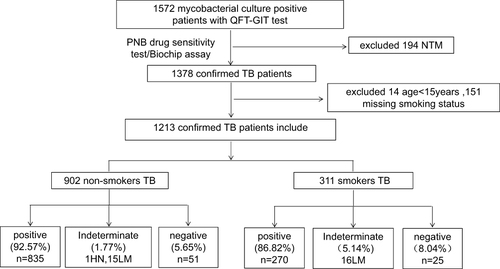
Figure 2 Effects of smoking on IFN-γlevels in different age groups. (A) total patients. (B) paitents’ age < 65 years. (C) patients’ age ≥ 65 years.
Notes: Nil, levels of Interferon-γ were measured in supernatants from QuantiFERON-TB Gold In tube blood collection tubes after incubation with saline; Antigen, (M) tuberculosis-specific antigens; Mitogen, phytohaemagglutinin.
Abbreviations: ns, non-smokers; s, smokers.
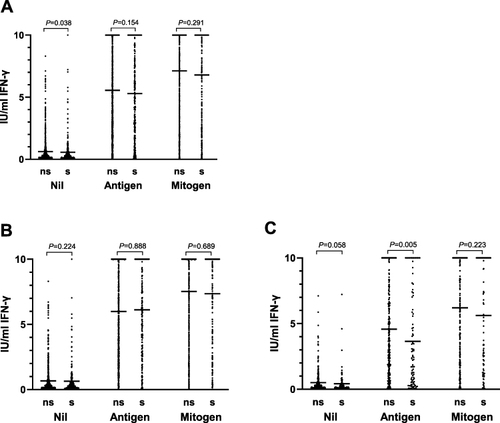
Table 1 Comparison of Background Characteristics of Smokers and Non-Smokers Before and After Matching
Table 2 Logistic Regression Analysis of the Influence of Smoking on the Inconsistency Between QFT Detection and Tuberculosis Etiology
Table 3 Comparison of Smoking After Propensity Matching by Logistic Regression Analysis
Table 4 Logistic Regression Analysis of the Influence of Smoking on the Inconsistency Between QFT Detection and Tuberculosis Etiology in Patients Aged ≥65 Years