Figures & data
Table 1 The Minimum Inhibitory Concentration of Donor Bacteria, Recipient Bacteria and Conjugant (MIC, μg /Ml)
Figure 1 S1-PFGE profiles and Southern blotting results. From left to right: S1-PFGE profiles; Southern blotting results: The red arrow indicates the hybridization and localization of the plasmid carrying the blaOXA-181 gene. Southern blotting results: The blue arrow indicates the hybridization and localization of the plasmid carrying the blaNDM-5 gene.
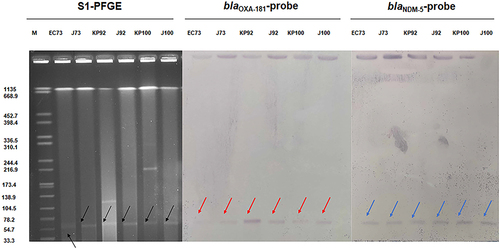
Figure 2 Comparison of NZ_CP024825.1, NZ_CP026727.1, KP100, KP92 and EC73 genomes from the outside in.
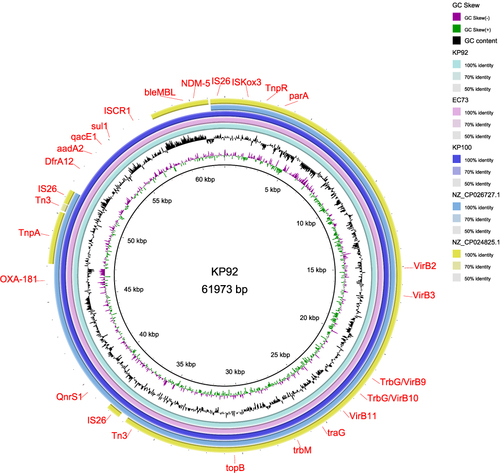
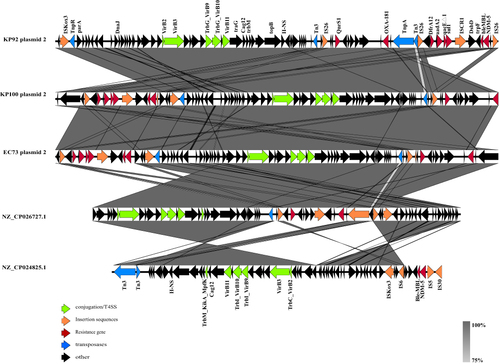
Figure 3 Comparative gene cluster analysis. Arrows indicate open reading frames arranged in the direction of transcription. The gene functions are represented by different colors. The red region represents drug resistance genes, the green region represents genes related to plasmid conjugation, the Orange regions represent insertion elements, the blue regions represent transposons, and the black regions encode other genes. Gray shaded areas indicate sequences that are highly similar sequences between plasmids.