Figures & data
Table 1 Protease activity of Staphylococcus aureus cells
Table 2 Protease activity of Pseudomonas aeruginosa cells
Figure 1 Electrophoretic profile of LPS of Pseudomonas aeruginosa.
Notes: Lane 1, LPS extracted from biofilm cells; lane 2, LPS extracted from planktonic cells; lane 3, LPS extracted from biofilm cells treated with (1/8) MIC of ceftazidime; lane 4, LPS extracted from biofilm cells treated with (1/4) MIC of ciprofloxacin; lane 5, LPS extracted from biofilm cells treated with (1/8) MIC of amikacin.
Abbreviations: LPS, lipopolysaccharide; MIC, minimum inhibitory concentration.
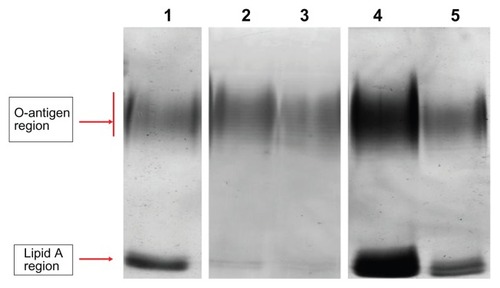
Table S1 Minimum inhibitory concentration values of Staphylococcus aureus planktonic and biofilm cells
Table S2 Minimum inhibitory concentration values of Pseudomonas aeruginosa planktonic and biofilm cells