Figures & data
Figure 1 Microscopic view of lung tissue from the upper lobe of the right lung (HE stain, 10*10). A small mass of fungal mycelium-like structure (black arrow) was seen around the lung tissue, with a relatively uniform thickness of the mycelium, which was considered morphologically as an Aspergillus infection.
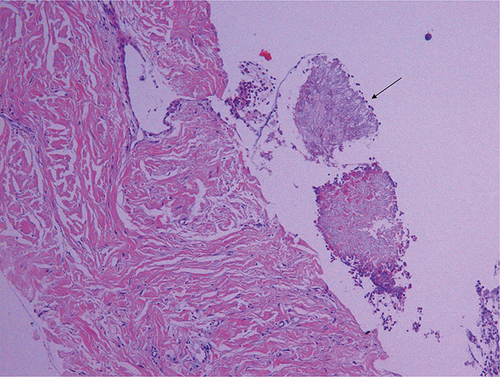
Figure 2 Changes in liver enzyme levels and drug trough concentrations during azole treatment. Symbols: *Voriconazole therapy; #Posaconazole therapy.
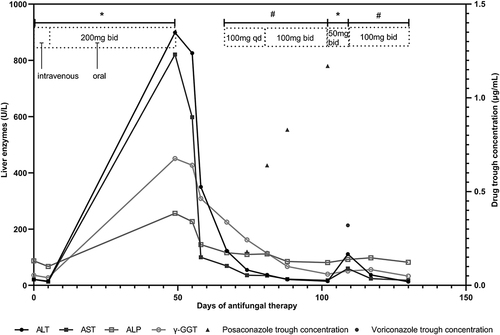
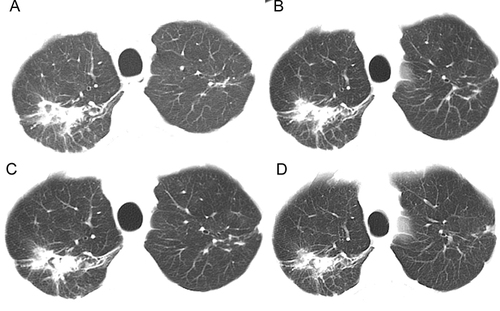
Figure 3 Changes in the images of the upper lobe of the right lung shown on chest CT before and after pulmonary Aspergillus infection and during antifungal procedures. Image (A) shows a chest CT image before the Aspergillus infection. Images (B–D) are chest CT images after the Aspergillus infection, representing images after 2, 4, and 5 months of antifungal therapy. Images (A–D) all show irregular nodular shadows in the upper lobe of the right lung with cavity formation. Images (A and B) show lesions of approximately similar extent but with increased density and fungus ball formation. Images (B–D) all show fungus ball formation but gradual resorption of the lesion.