
Figures & data
Figure 1 Frequency of antifungal resistance in the obtained C. albicans isolates (n = 204).
Notes: Resistance frequency of the tested antifungal agents among the obtained C. albicans isolates (n = 204). Regarding azoles, the highest resistance frequency was recorded with voriconazole (30.4%), followed by itraconazole (17.6%), fluconazole (11.3%), then econazole (6.4%). No resistance was recorded with nystatin or amphotericin B, and 6.4% were resistant to caspofungin.
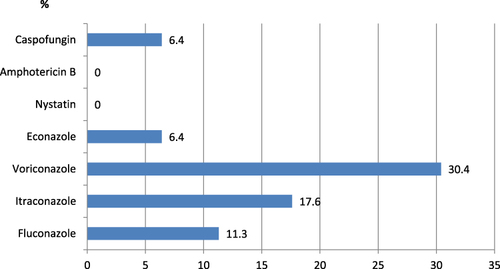
Figure 2 Biofilm formation among the obtained C. albicans isolates (n = 204).
Notes: A pie chart representing the frequency of biofilm formation among the obtained C. albicans (n = 204) as detected by the microtiter plate method. More than one-third of the isolates (36.8%) were non-producers. Biofilm producers (63.2%) were categorized into strong (14.7%), moderate (43.6%), and mild producers (4.9%).
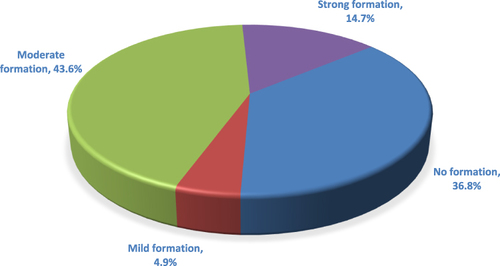
Figure 3 Gel electrophoresis of PCR targeting the biofilm-related genes HWP1 (572 bp) and ALS1 (318 bp) as well as the protease gene SAP2 (178 bp) (a) and two other protease genes SAP4 (171 bp) and SAP6 (187 bp) (b).
Notes: (a) Lane L; 100 bp ladder, lane 5; negative control, lanes 1–4 and 6–8 demonstrate both the HWP1 and ALS1 genes, and lanes 3 and 6 demonstrate additionally the SAP2 gene. (b) Lane L; 100 bp ladder, lane 8; negative control, lanes 2 and 4 demonstrate the SAP4 gene, and lane 6 demonstrates the SAP6 gene.
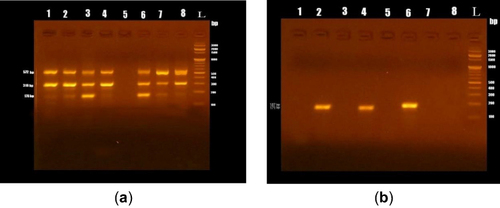
Table 1 Relationship Between Biofilm Formation and Azole Resistance in the Obtained C. albicans Isolates (n = 204)
Table 2 Relationship Between Aspartyl Proteinase Production and Azole Resistance in the Obtained C. albicans Isolates (n = 204)
Data Sharing Statement
All data and materials related to the study are included in the current manuscript and in the Supplementary Tables.