
Figures & data
Table 1 Univariate Analysis of Risk Factors for Extended-Spectrum β-Lactamase Producing Enterobacterales (ESBL-E), n (%)
Figure 1 Interrupted time series analysis of the incidence of infections by ESBL-E. Baseline: weeks 1–8 are the weekly incidence of infections by ESBL-E before COVID-19 (December 8, 2021 to February 1, 2022); Intervention stage: weeks 9–16 are the weekly incidence of infections by ESBL-E during the COVID-19 pandemic (December 8, 2022 to February 1, 2023). The black dots indicate the actual weekly incidence of infection by ESBL-E; The dotted line indicates the start of the intervention, which is the beginning of the COVID-19 pandemic; The solid line indicates the incidence of infection by ESBL-E as predicted by the ITSA model.
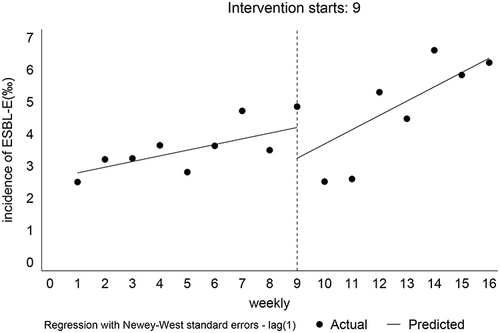
Figure 2 LASSO Logistic regression. (a) LASSO coefficient profiles of the 27 variables. As the value of λ decreases, the function of the model to select important variables is enhanced; (b) The cross-validation results. The left dashed line corresponds to the parameter lambda.min, and the right dashed line corresponds to the parameter lambda.1se. The left solid line was chosen as the best λ value. 13 variables were selected when λ = 0.021.
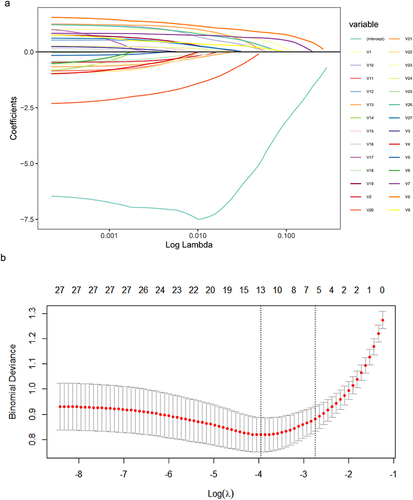
Table 2 Multivariate Logistic Regression Analysis of Risk Factors for Extended-Spectrum β-Lactamase Producing Enterobacterales (ESBL-E), OR (95% CI)