Figures & data
Table 1 Characteristics of the Patients
Figure 1 Flow diagram of patient’s inclusion in this study.
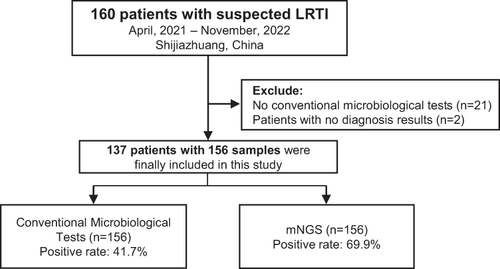
Figure 2 Pathogen detection rate and concordance between CMT and mNGS. (A) The positive rate of mNGS for different kinds of specimen. (B) The positive rate of CMT and mNGS results. P value present with ****Indicating less than 0.0001. (C) Concordance of detected pathogens between mNGS and CMT.
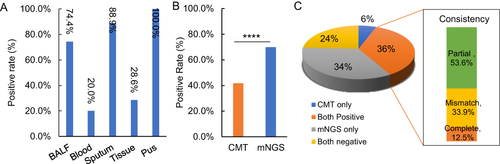
Table 2 The Samples with Only Positive Pathogen Results by CMT
Figure 3 Pathogens identified by CMT and mNGS. (A) Veen diagram showed the overlapped numbers of pathogen species detected by mNGS and CMT. (B) The type of infected pathogens for the patients based on the CMT and mNGS results.
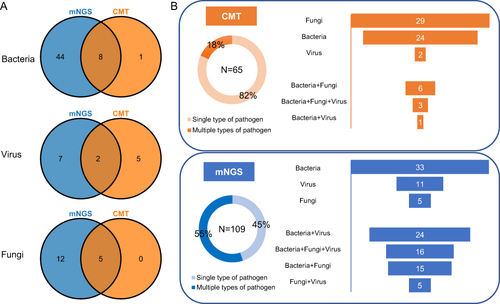
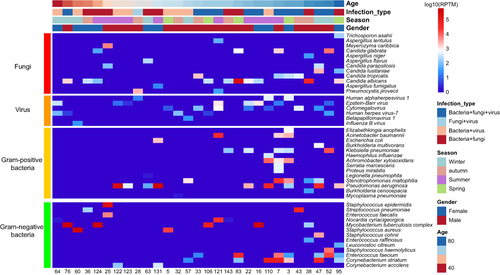
Figure 4 Pathogen profiles detected by mNGS and CMT.
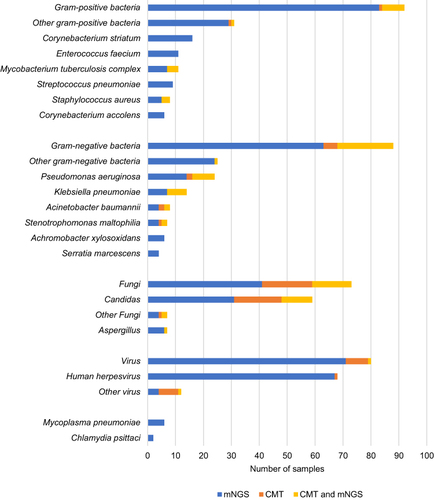
Figure 5 Seasonal prevalence of the pathogens detected by both mNGS and CMT.
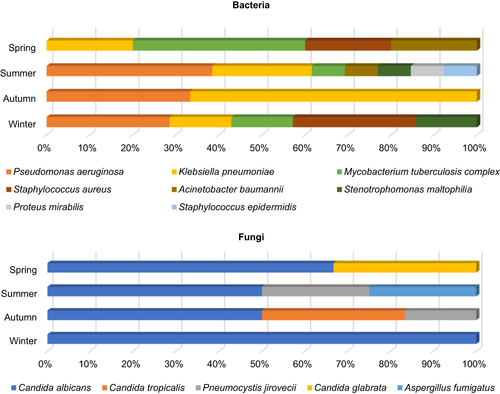
Figure 6 Seasonal prevalence of the pathogens detected by mNGS. (A) The distribution of gram-negative bacteria. (B) The distribution of gram-positive bacteria. (C) The seasonal prevalence of fungi. (D) Virus distribution based on seasons. “Other” represents the set of bacteria present in only one sample.
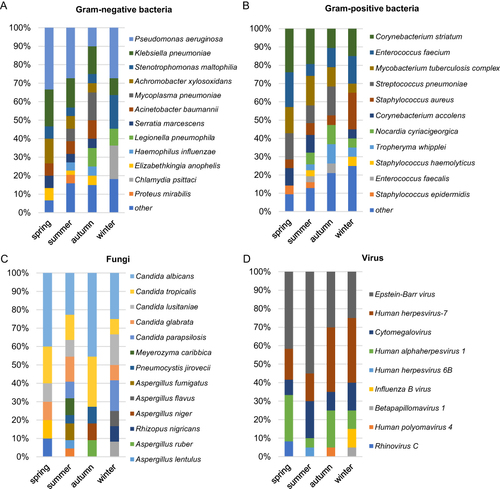
Figure 7 Heatmap of pathogens in samples with at least one consistent pathogen between mNGS and CMT.