Figures & data
Figure 1 The flowchart.
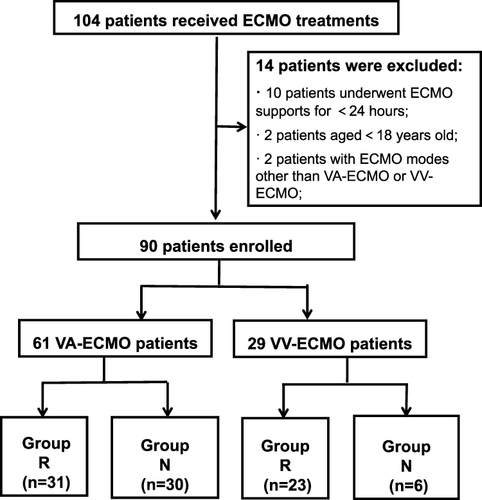
Table 1 The Clinical Characteristics of ECMO Patients With or Without MDR Infections
Table 2 The Partial Correlation Analysis of MDR Bacterial Infection and Prognosis Indicators
Figure 2 Outcomes of ECMO patients displayed separately according to whether they were infected by MDR bacteria.
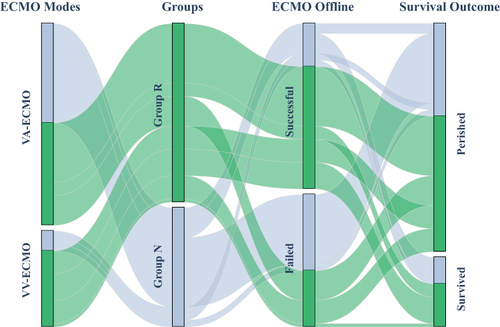
Table 3 The Species of MDR Pathogens in ECMO Patients
Table 4 The Sources of MDR Pathogens in ECMO Patients
Figure 3 Species and sources of MDR pathogens in ECMO patients. The left part of the figure shows the species and sources of MDR pathogens in VA-ECMO patients. The right part of the figure shows the species and sources of MDR pathogens in VV-ECMO patients. Each column represents a patient with MDR infection and each row the bacterium detected. The pathogens were divided into three categories: GPB (Gram-positive bacteria) and GNB (Gram-negative bacteria). The different colors of blocks represent the source of MDR pathogen. The specific meaning of colors are shown in the color indicator on the right of the figure.
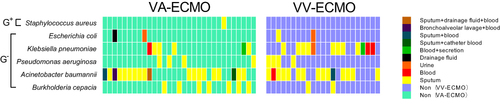
Figure 4 The variety of MDR-GNB of ECMO and other ICU patients.
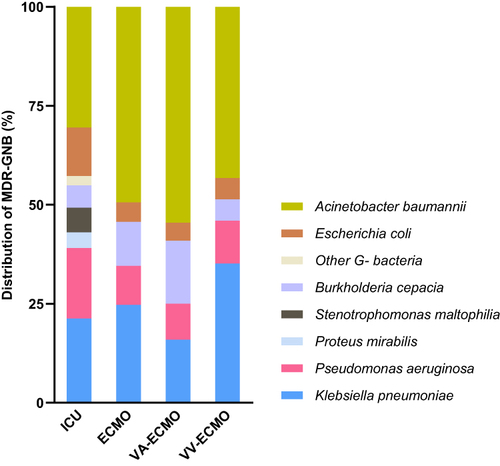
Table 5 The Resistance Ratio of MDR Bacteria to Antibiotics in ECMO Patients
Figure 5 Heatmap showing the antimicrobial susceptibility results of MDR bacteria in ECMO patients. Each column represented a bacterium detected and each row an antibiotic of antimicrobial susceptibility tests. All of the drugs were divided into six categories according to their functions. The different colors of blocks represent antimicrobial susceptibility to the drugs. The results of antimicrobial susceptibility were divided into three categories: resistant, intermediary and sensitive. The specific meanings of colors are shown in the color indicators on the right of the figure.
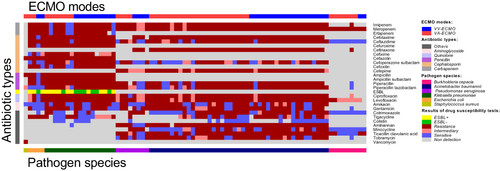
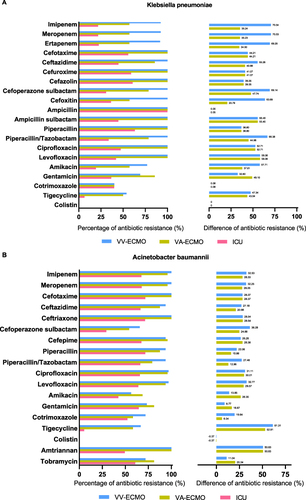
Figure 6 The comparison of drug resistance profiles of MDR bacteria between ECMO and other ICU patients. (A) The comparison of drug resistance profiles of Klebsiella pneumoniae (MDR-KP) in ECMO and other ICU patients in our department. The left columns of (A) represent the resistance rates of MDR-KP to antibiotics in ECMO and other ICU patients. The columns of (A) on the right are the differences in resistance rates of MDR-KP between ECMO and other ICU patients in our department. (B) The comparison of drug resistance profiles of Acinetobacter baumannii (MDR-AB) in ECMO and other ICU patients in our department. The left columns of (B) represent the resistance rates of MDR-AB to antibiotics in ECMO and other ICU patients. The columns of (B) on the right show the differences in resistance rates of MDR-AB between ECMO and other ICU patients in our department.