Figures & data
Figure 1 Flowchart of the diagnosis model of HIV-infected people with BSI.
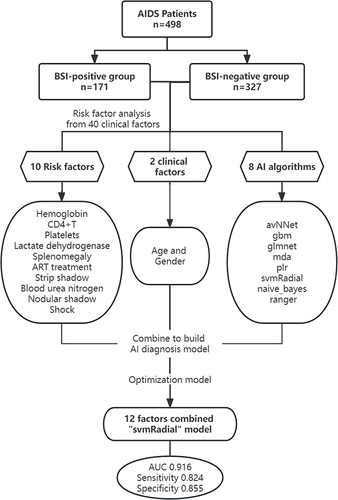
Table 1 The Correlation of the Clinical Features and BSI of Individuals
Table 2 The Distribution of Pathogenic Bacteria in HIV-Infected People with BSI (N=171)
Table 3 Multivariate Analysis of BSI in HIV-Infected People
Table 4 The ROC Analysis of the Risk Factors of HIV-Infected People with BSI
Table 5 The Baseline Information of Training Set and Validation Set
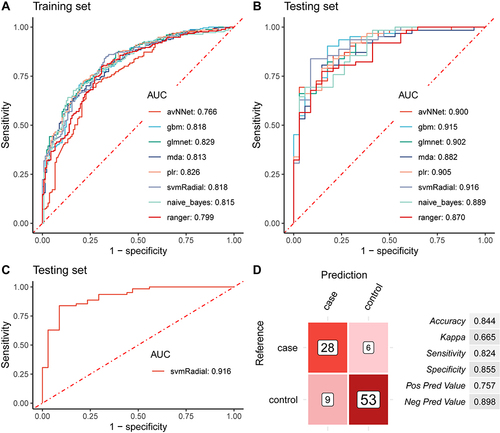
Figure 2 Evaluation of the diagnosis power of the 12 factors combined AI Algorithm in HIV-infected people with BSI. (A). ROC curves of the 12-factor-based optimal models constructed by the eight algorithms in the training and (B). Testing datasets. (C). ROC curves of the 12-factor-based “svmRadial” model in testing datasets, AUC=0.916. (D). The evaluation indicators of the 12-factor-based“svmRadial”model diagnosis efficacy.