Figures & data
Table 1 Clinical Information of 19 Patients with Otitis Media with Effusion
Figure 1 Workflow for OME proteome analysis; *Two experimental groups: simple OME group (12 samples) and radiotherapy-reduced group (7 samples); **Two further subdivided subgroups: nasopharyngeal carcinoma (NPC) group (5 samples) and other types of tumors group (2 samples).
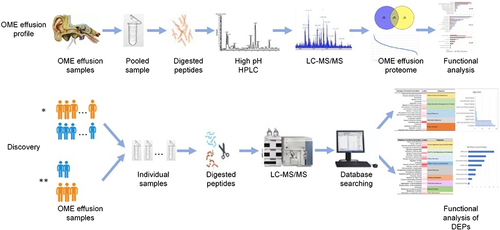
Figure 2 Correlation of QC samples. Reproducibility of proteins of DIA-MS analysis. Each dot refers to one protein. Dots in yellow refer to high correlations (r value tends to 1) while dots in blue refer to low correlations (r value tends to 0). Red dots represent proteins with mid-level correlations whose r-values close to 0.5.
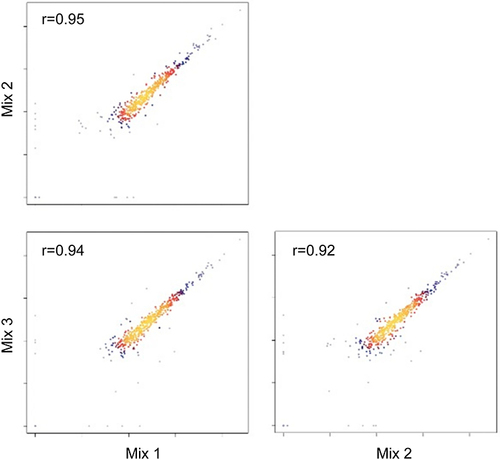
Figure 3 Protein abundance rank. Quantitative protein abundance range in OME samples with an iBAQ algorithm (left y-axis) and cumulative protein abundances of the OME proteome (right y-axis).
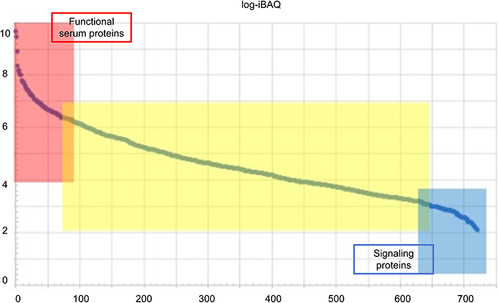
Figure 4 Venn diagram of protein identification in OME patients’ middle ear charge and serum from healthy volunteers.
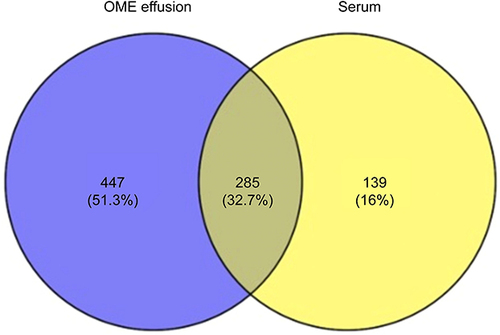
Figure 5 GO analysis of the OME proteome compared with the serum proteome ((A) GO-biological process, (B) GO-cellular component and (C) GO-molecular function).
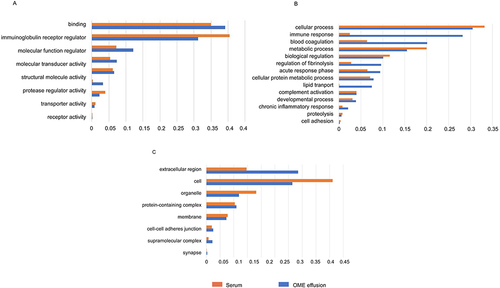
Figure 6 IPA analysis of proteins in mid and low abundance group. (A) The diseases or functions annotation; (B) The major canonical pathways. The color of the bar in MID and LOW column indicates the level of significance.
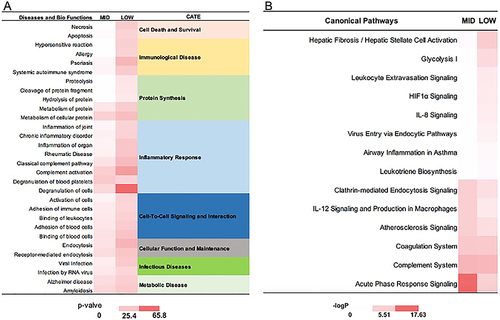
Table 2 The 8 Top Abundant Proteins in Normal AF Proteome
Figure 7 Analysis of DEPs between simple OME and group and radiotherapy-reduced OME group. (A) Volcano plot. Sig.Down[1], the number of significantly downregulated protein is 1; Sig.Up[119], the number of significantly upregulated protein is 119; Unsig.[311], the number of proteins with no significant changing trend is 311. Red dots refer to upregulate protein and blue dot refers to downregulate protein. Gray dots represent for proteins which show no significant changing trend. (B) PLS-DA and (C) PCA, simple OME samples are in red while radiotherapy-reduced OME samples are in green. (D) Heatmap for DEPs. Group 1(red) represents for simple OME group, group 2(green) represents for radiotherapy-reduced OME group.
![Figure 7 Analysis of DEPs between simple OME and group and radiotherapy-reduced OME group. (A) Volcano plot. Sig.Down[1], the number of significantly downregulated protein is 1; Sig.Up[119], the number of significantly upregulated protein is 119; Unsig.[311], the number of proteins with no significant changing trend is 311. Red dots refer to upregulate protein and blue dot refers to downregulate protein. Gray dots represent for proteins which show no significant changing trend. (B) PLS-DA and (C) PCA, simple OME samples are in red while radiotherapy-reduced OME samples are in green. (D) Heatmap for DEPs. Group 1(red) represents for simple OME group, group 2(green) represents for radiotherapy-reduced OME group.](/cms/asset/61af2dba-4dc2-4d9d-bb6c-ff56d9d4f00f/didr_a_12295392_f0007_c.jpg)
Figure 8 IPA analysis of DEPs between simple OME and group and radiotherapy-reduced OME group. (A) The diseases or functions annotation; (B) The major canonical pathways. The color of the bar in p-value and -logP column indicates the level of significance.
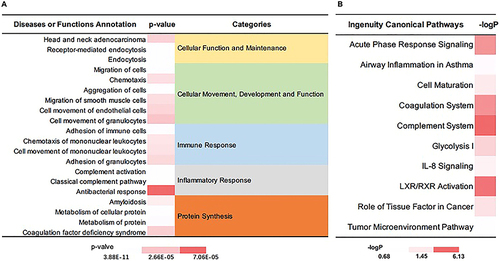
Table 3 Clinical Information of 7 Patients in Radiotherapy-Reduced OME Group
Figure 9 Analysis of DEPs of patients radiotherapy-reduced OME group. (A) Heatmap for DEPs. Group 1(red) represents for nasopharyngeal carcinoma group, group 2(green) represents for patients with other kinds of malignant tumor. (B) PLS-DA. NPC samples are in red while other samples are in green. (C) Volcano plot. Sig.Down[23], the number of significantly downregulated protein is 23; Sig.Up[14], the number of significantly upregulated protein is 14; Unsig.[394], the number of proteins with no significant changing trend is 394. Red dots refer to upregulate protein and blue dot refers to downregulate protein. Gray dots represent for proteins which show no significant changing trend.
![Figure 9 Analysis of DEPs of patients radiotherapy-reduced OME group. (A) Heatmap for DEPs. Group 1(red) represents for nasopharyngeal carcinoma group, group 2(green) represents for patients with other kinds of malignant tumor. (B) PLS-DA. NPC samples are in red while other samples are in green. (C) Volcano plot. Sig.Down[23], the number of significantly downregulated protein is 23; Sig.Up[14], the number of significantly upregulated protein is 14; Unsig.[394], the number of proteins with no significant changing trend is 394. Red dots refer to upregulate protein and blue dot refers to downregulate protein. Gray dots represent for proteins which show no significant changing trend.](/cms/asset/a763dcd4-9447-4e10-9221-f8b6e1d5af03/didr_a_12295392_f0009_c.jpg)
Figure 10 IPA analysis of DEPs in radiotherapy-reduced OME group. (A) The diseases or functions annotation; (B) The major canonical pathways. The color of the bar in p-value and -logP column indicates the level of significance.
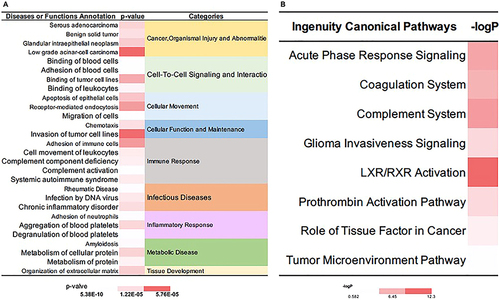
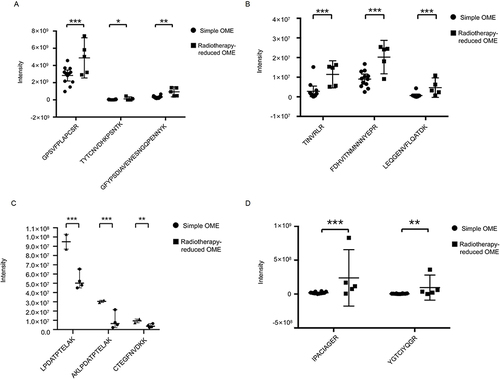
Figure 11 The validated proteins by PRM method. Peptides form the same protein are shown in a plot. The asterisks indicate the level of significance. *P<0.05; **P<0.01; ***P<0.001. (A) G4m marker. (B) Complement C1q B chain. (C) Vitamin D Binding Protein. (D) Defensin alpha 3.