Figures & data
Figure 1 PPI network analysis of QRHJ decoction in IP treatment. (A) PPI network of drug target genes and IP disease-related genes. (B) Venn diagram of drug target genes and IP disease-related genes. (C) Interaction networks of active ingredients and genes of 10 herbs in QRHJ decoction. The red hexagonal nodes represent remedies, the light cyan diamond nodes represent herbs, the blue triangular nodes represent active ingredients in herbs, and the green circular nodes represent genes that may respond to drugs.
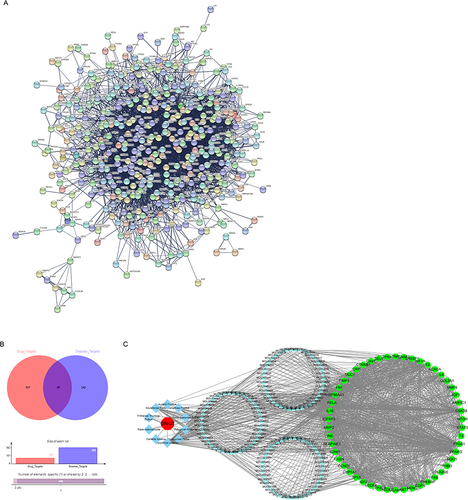
Figure 2 GO and KEGG enrichment analyses of top 50 genes in affinity coefficient in drug-active ingredient-target network. (A) Bubble chart of GO enrichment analysis. (B) Bubble chart of KEGG enrichment analysis.
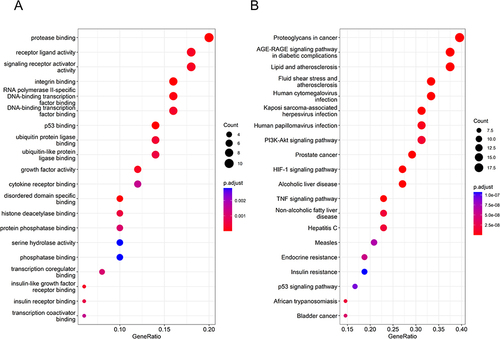
Table 1 Pocket Prediction Table for IL6, EGFR and HIF1A Structures
Table 2 Molecular Docking Results of IL-6, EGFR and HIF1A with Active Small Molecules
Figure 3 Statistics of core degree in the interaction network graph, with the horizontal coordinate indicating degrees and the vertical coordinate indicating gene names.
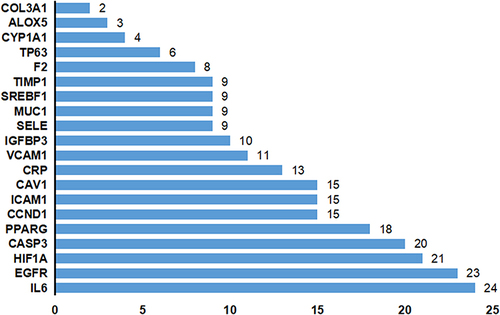
Table 3 Physicochemical Properties of the Core Compounds
Table 4 ADMET Properties of the Core Compound
Figure 4 Molecular docking simulation analysis results. (A) 3D plot of the molecular model of diosgenin in the key binding site of HIF1A pocket. (B) 2D diagram of the molecular model of molecular docking of HIF1A binding to diosgenin. (C) 3D plot of the molecular model of luteolin in the key binding site of EGFR pocket. (D) 2D diagram of the molecular model of molecular docking of EGFR binding to luteolin.
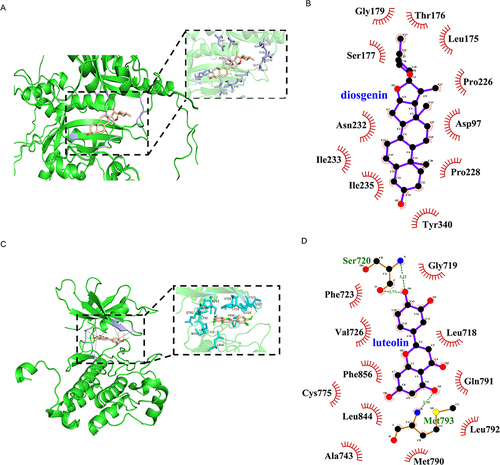
Figure 5 Results of MD simulation analysis. (A) RMSD diagram of protein HIF1A backbone atoms during MD simulations. (B) RMSD diagram of protein EGFR backbone atoms during MD simulations. (C) Gyration radius diagram of the protein HIF1A during MD simulation. (D) Gyration radius diagram of the protein EGFR during MD simulation. (E) RMSF diagram of protein HIF1A residues during MD simulation. (F) RMSF diagram of protein EGFR residues during MD simulation. (G) Number of hydrogen bonds in small molecule diosgenin binding HIF1A protein during MD simulation. (H) Number of hydrogen bonds in small molecule luteolin binding protein EGFR during MD simulation.
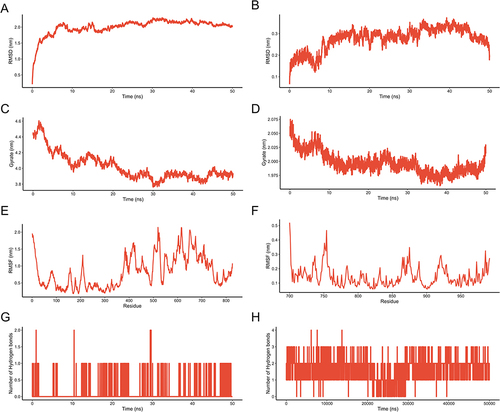
Figure 6 PCA diagram based on trajectories. (A) Trajectory based principal component analysis diagram of HIF1A-diosgenin complex. (B) Trajectory based principal component analysis diagram of EGFR-luteolin complex. (C) Motion trajectory diagram of HIF1A-diosgenin complex ① PC1, ② PC2, ③ PC3. (D) Motion trajectory diagram of EGFR-luteolin complex ① PC1, ② PC2, ③ PC3.
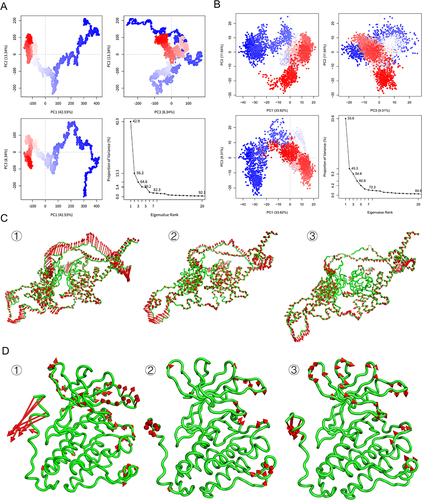
Figure 7 Residue intercorrelation diagram. (A) HIF1A residue cross-correlation diagram. (B) EGFR residue cross-correlation diagram. The blue part indicates synergy, and the red part indicates relative motion. The horizontal and vertical coordinates represent the amino acid sequence label.
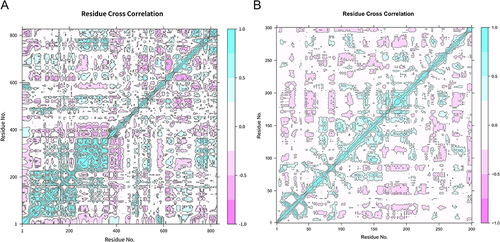
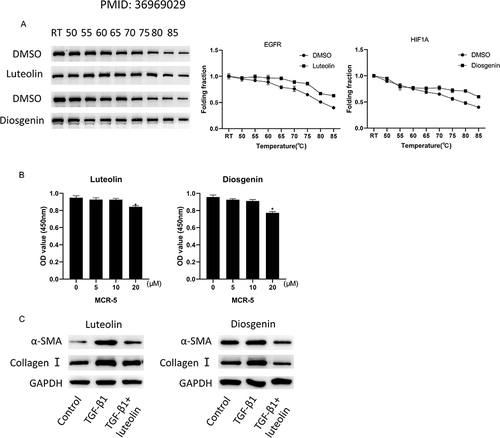
Figure 8 The effect of QRHJ effective active ingredients on HELF cell fibrosis. (A) CETSA was performed on MCR-5 cells treated with luteolin, diosgenin or DMSO; (B) CCK-8 was used to detect the effect of different concentrations of luteolin and diosgenin on the activity of HELF cells; (C) Western blot was used to determine the expression of fibrosis-related proteins induced by TGF-β1 after luteolin and diosgenin treatment. *P<0.05.