Figures & data
Table 1 Selected β-Lactams and Their Concentration Range Used for Determination of the Minimal Inhibitory Concentration
Table 2 Primers and the Expected Size of PCR Products for Detection of Genes Encoding β-Lactamases
Table 3 Primers and the Expected Size of PCR Products of Genes Encoding the Efflux Pumps and the Repressor from RND Family Superfamily and the Reference Gene rpsL
Table 4 Classification of E. coli Isolates and the Control Strain ATCC 25922 Based on the Minimal Inhibitory Concentration (MIC) to Ampicillin (AMP). The BD Phoenix System Classification of Isolates as Susceptible (S) and Resistant (R) to Ampicillin (AMP), Piperacillin (PIP) and Amoxicillin-Clavulanic Acid (AMC)
Table 5 Prevalence of β-Lactam Resistance Genes in E. coli Isolates
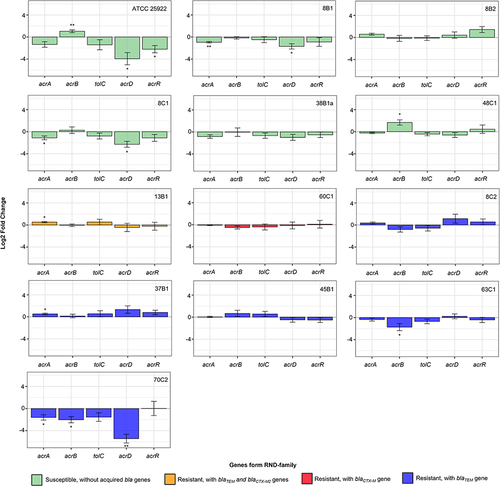
Figure 1 Expression of tested genes acrA, acrB, tolC, acrD and acrR from RND family in E. coli isolates: ATCC 25922, 8B1, 8B2, 8C1, 38B1a, 48C1, 13B1, 60C1, 8C2, 37B1, 45B1, 63C1, 70C2 after AMP treatment normalized to gene rpsL. Untreated and treated isolate after AMP exposure were compared and significance was calculated by unpaired t-test from ΔCt values. The significance is represented as stars according to the p-value (* p-value ≤ 0.05, ** p-value ≤ 0.01) above or below the column. Green coloured columns represent susceptible isolates, Orange isolates containing two acquired bla genes, blue and red isolates containing only one type of bla gene.