Figures & data
Figure 1 PBMC TM expression analysis. (A) PBMC TM expression levels in patients at different disease stages. (B) ROC curve of PBMC TM expression levels for distinguishing HBV-ACLF from ACHD. (C) PBMC TM expression levels in HBV-ACLF patients with different outcomes at 28 days. (D) ROC curve of PBMC TM expression levels for predicting the 28-day mortality rates of HBV-ACLF patients. (E) PBMC TM expression levels in HBV-ACLF patients with different outcomes at 90 days. (F) ROC curve of PBMC TM expression levels for predicting the 90-day mortality rates of HBV-ACLF patients.
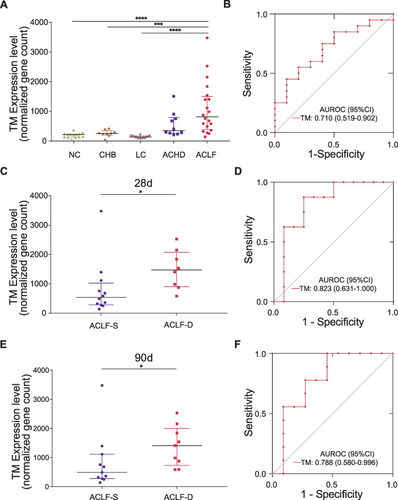
Figure 2 Functional analysis of TM. Histogram showing the Pearson correlation coefficients for the relationships between TM mRNA expression levels and BTMs (left) and GO biological processes (right). The terms that are positively or negatively correlated are shown in red or blue, respectively. The top 20 terms with high correlation coefficients are displayed.
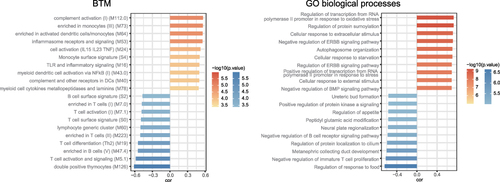
Table 1 Clinical Characteristics of the Patients in the ELISA Group
Figure 3 The use of plasma TM concentrations for diagnosing HBV-ACLF at admission. (A) Plasma TM concentrations in patients at different disease stages. (B) ROC curve of plasma TM concentrations for distinguishing HBV-ACLF from ACHD. ****P < 0.0001.
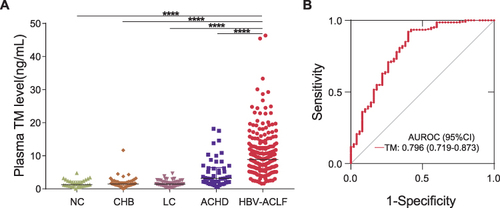
Table 2 Associations of Clinical Parameters and Prognostic Scoring Systems with Plasma TM Concentration in Patients with HBV-ACLF
Figure 4 Plasma TM concentrations are related to the severity of HBV‐ACLF. (A) Plasma TM concentrations in ACLF‐1 and ACLF‐2/3 patients. (B) Plasma TM concentrations in patients stratified by COSSH-ACLF IIs. (C) Plasma TM concentrations and coagulation failure. (D) Plasma TM concentrations and kidney failure. (E) Plasma TM concentrations and cerebral failure. *P < 0.5; ***P < 0.001; ****P < 0.0001.
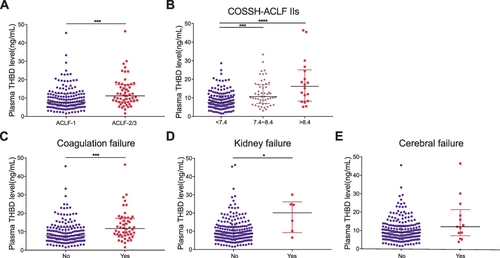
Table 3 Characteristics of Patients in ACLF-D and ACLF-S Group at 28 Days
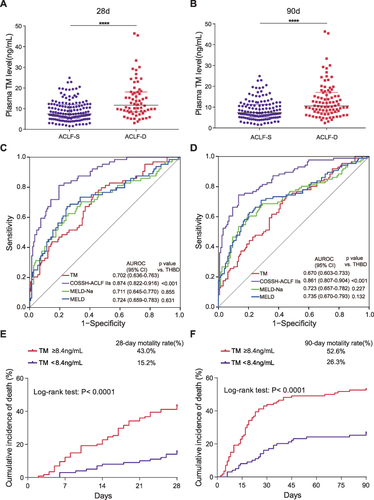
Figure 5 The use of plasma TM concentrations for predicting the 28-day and 90-day mortality rates of HBV-ACLF patients. (A) Plasma TM concentrations in HBV-ACLF patients with different outcomes at 28 days. (B) Plasma TM concentrations in HBV-ACLF patients with different outcomes at 90 days. (C) ROC curve of plasma TM concentrations for predicting the 28-day mortality rates of HBV-ACLF patients compared to other clinical scores. (D) ROC curve of plasma TM concentrations for predicting the 90-day mortality rates of HBV-ACLF patients compared to other clinical scores. (E) Cumulative incidence of death (high‐/low‐risk: plasma TM concentrations ≥8.4/<8.4 ng/mL) in patients with HBV-ACLF in 28 days. (F) Cumulative incidence of death in patients with HBV-ACLF in 90 days. ****P < 0.0001.