Figures & data
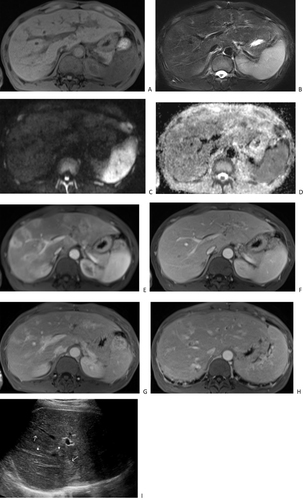
Figure 1 A 46-year-old man with AIDS-related hepatic Kaposi’s sarcoma. Plain scan MRI shows multiple nodular lesions in the liver, with low signal on T1 weighted imaging (1A), high signal on T2 weighted imaging (B), slightly high signal on diffusion weighted imaging (C), and high signal on apparent diffusion coefficient imaging (D). Enhanced scanning of the arterial phase (E) showed circular enhancement, located adjacent to the portal vein and under the hepatic capsule. The portal vein phase (F) shows gradual enhancement of nodules, showing equal to slightly lower enhancement, and dilation of intrahepatic bile ducts. The delayed phase (G) shows high and equal enhancement of the nodules, with intrahepatic bile duct dilation observed. Ultrasound (H) showed multiple hypoechogenicity (arrow) in the liver, as well as thickening and enhancement of the Glisson sheath (arrowhead). After 40 days, ultrasound (I) revealed multiple hyperechoic nodules in the liver (arrows), as well as thickening and enhancement of the Glisson sheath (arrowhead). The pathological HE staining (J) of the puncture biopsy showed residual liver tissue on the left side and a tumor area on the right. The spindle shaped tumor cells were arranged in a striped pattern, with some appearing as fissures. The nucleus was ovoid, and the cells were mildly atypical. No clear mitotic image was observed (HE X200). Human herpesvirus 8 immunohistochemistry staining (K) showed partial spindle cell nucleus positivity (EnVision X200).
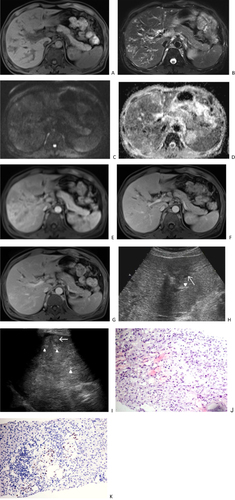
Table 1 The Imaging Features of AIDS-Related Hepatic Kaposi’s Sarcoma on CT, MRI, and Ultrasound
Figure 2 A 30-year-old man with AIDS-related hepatic Kaposi’s sarcoma. CT plain scan shows multiple low-density nodules in the liver (A). CT enhanced scan during the arterial phase showed circular enhancement of nodular lesions, mostly located around the portal vein and a few located under the hepatic capsule (B). The portal vein phase (C) and delayed phase (D) show gradual enhancement of the nodules, with equal or slightly lower enhancement. Ultrasound (E) showed multiple hyperechoic nodules (arrows) distributed along the portal vein in the liver, with thickening of the Glisson sheath and enhanced echogenicity (arrowhead). Two years later, the CT scan (F) Showed that the original intrahepatic nodules were not shown.
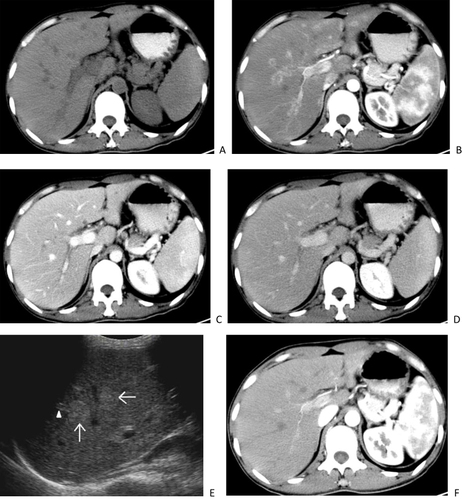
Figure 3 A 41-year-old man with AIDS-related hepatic Kaposi’s sarcoma. Plain scan MRI shows multiple nodular lesions in the liver, with low signal on T1 weighted imaging (A), high signal on T2 weighted imaging (B), slightly high signal on diffusion weighted imaging (C), and high signal on apparent diffusion coefficient map (D). Enhanced scanning of the arterial phase (E) showed circular enhancement, located adjacent to the portal vein and under the hepatic capsule. The portal vein phase (F) shows gradual enhancement of nodules with equal to slightly lower enhancement. Delayed phase imaging (G) showed high and equal enhancement of the nodules, as well as intrahepatic bile duct dilation and thickening of the bile duct wall (H). Ultrasound (I) showed multiple hyperechoic nodules (arrows) distributed along the portal vein in the liver, with thickening of the Glisson sheath and enhanced echogenicity (arrowhead).