Figures & data
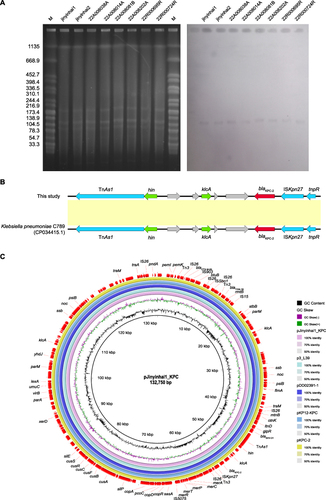
Figure 1 (A) Clinical diagnosis and treatment of patients. (B) Changes in infection during hospitalization. HAA, homoharringtonine combined aclarubicin and cytarabine; IA, idarubicin combined with cytarabine; Ara-c, cytarabine; FACT, functional assessment of cancer treatment; HSCT, hematopoietic stem cell transplantation.
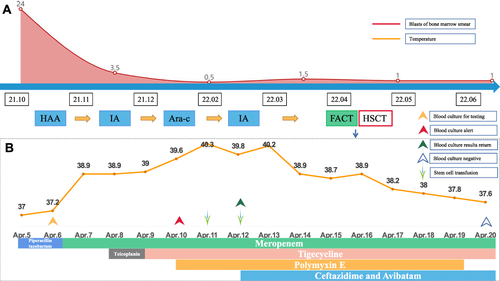
Table 1 The Isolation Time and Sources of Eight ST11-CR-HvKP Isolates
Table 2 Antimicrobial Susceptibilities of Eight ST11-CR-HvKP Isolates
Figure 2 A comparative genome analysis of eight ST11-CR-HvKP isolates based on core genome SNPs. Isolates with zero cgSNP differences were marked by the same color. The collection dates, isolation sources, and antimicrobial resistance genes are shown. Blue indicates that the isolate carries such genes and colorless means that the genes are not present.
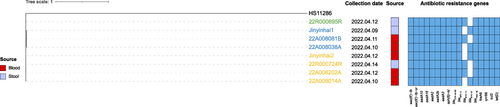
Table 3 The Biofilm-Forming Ability of Eight ST11-CR-HvKP Isolates
Figure 3 The genetic features of eight ST11-CR-HvKP isolates. (A) Plasmid profiles of eight ST11-CR-HvKP. (B) Genetic context of blaKPC-2 genes in this study. (C) Comparative analysis of plasmid pJinyinhai1_KPC detected in K. pneumoniae Jinyinhai1.