
Figures & data
Table 1 The Characteristics of the Peritoneal Dialysis-Associated Peritonitis Patients Between the 2002–2011 and 2014–2023 Groups
Table 2 The Compositions of the Cause-Special Peritonitis Between the 2002–2011 and 2014–2023 Groups
Figure 1 The change of antimicrobial sensitivity in gram-positive cocci and gram-negative bacillary peritonitis between the 2002–2011 and 2014–2023 groups.
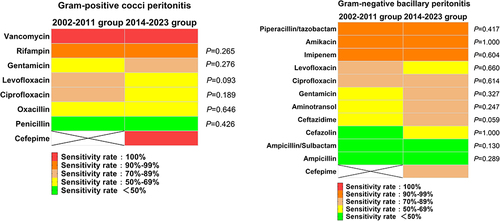
Table 3 Comparison of Prognosis Between the 2002–2011 and the 2014–2023 Groups
Table 4 Significant Risk Factors for the Gram-Negative Bacillary Peritonitis Prognosis During 2014–2023
Table 5 Significant Risk Factors for the Gram-Negative Bacillary Peritonitis Prognosis During 2014–2019