Figures & data
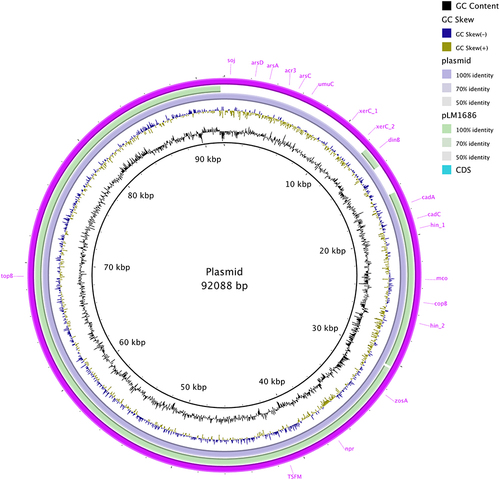
Figure 1 The timeline of the clinical presentations, assessment, and treatment of the pregnant women.
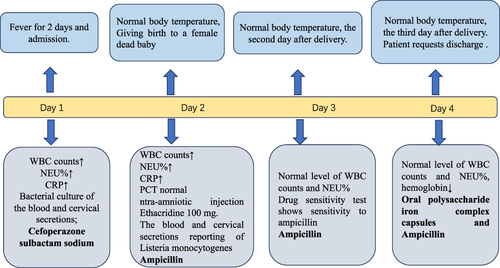
Figure 2 Pathologic sections of placental tissue in pregnant patient from in different fields of view.
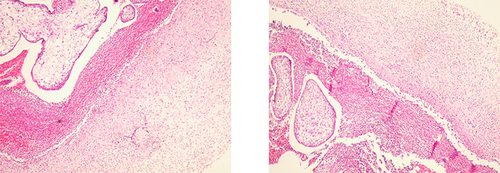
Figure 3 The core-SNP phylogenetic tree of 100 ST120 L. monocytogenes isolates. (A) The maximum likelihood phylogenetic tree was constructed by Raxml. The geographic location, date of isolation, and isolation source are shown on the tree (from inner to outer circles). (B) Minimum spanning tree show the relationship between the 100 ST120 isolates.
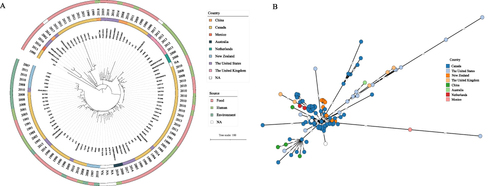
Figure 4 The plasmid comparison using BRIG with the plasmid pLM1686.