Figures & data

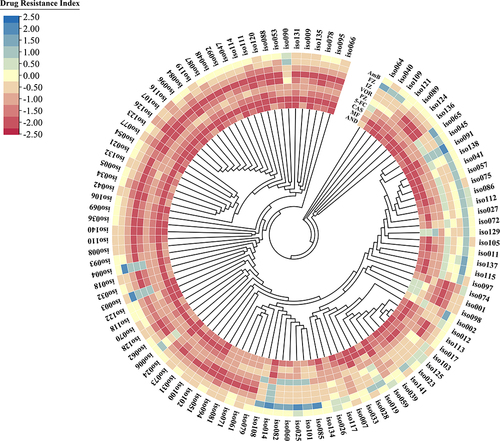
Figure 1 Identification of the Candida isolates (A–D) are colony morphology of Candida albicans, Candida glabrata, Candida tropicalis and Candida krusei on chromogenic medium (CHROMagar),respectively; (E–H) are morphology of Candida albicans,Candida glabrata, Candida tropicalis and Candida krusei calcofluor white staining under microscope, respectively (×400).
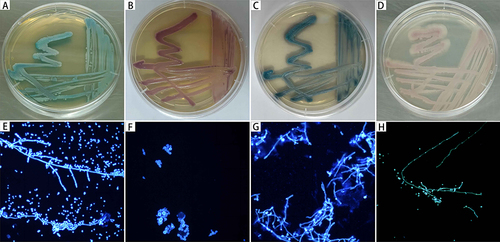
Figure 2 Distribution of Candida isolates in the clinical department.
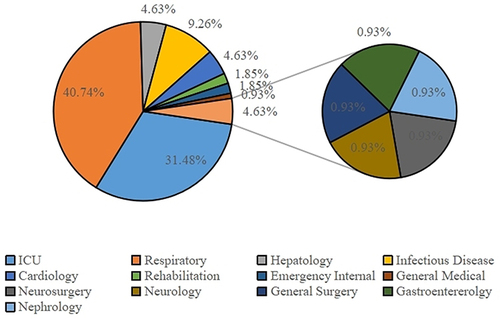
Table 1 Specimen Distribution of Candida Isolates [n(%)]
Table 2 In vitro Antifungal Susceptibility Profiles
Table 3 Multi-Drug Resistance and Cross-Resistance of Candida Strains
Table 4 Azoles Cross-Resistance of Candida Strains
Figure 3 Phylogenetic tree and heat map of drug resistance levels constructed based on ITS sequences. The heat map shows the drug resistance index for different strains of antifungal drugs. The outermost circle shows the strain number, with each column representing a strain, and each row representing an antifungal drug. The heat map values indicate the drug resistance index, which is calculated as the logarithm of the MIC value obtained from drug susceptibility testing.