
Figures & data
Table 1 Basic Detection Rate of Neonates with Ureaplasma urealyticum Infection
Figure 1 The distribution of Ureaplasma urealyticum positive rate among neonates in different ages.
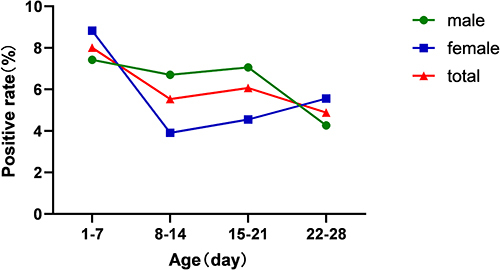
Figure 2 The distribution of Ureaplasma urealyticum positive rate among neonates in different seasons.
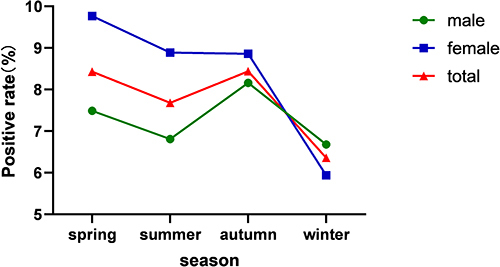
Figure 3 The distribution of Ureaplasma urealyticum positive rate among neonates in different months.
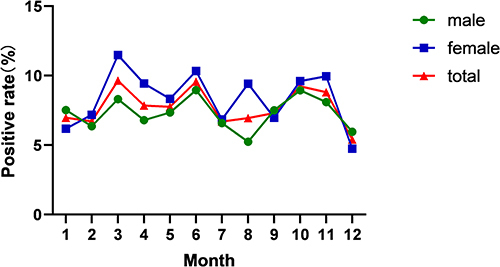
Table 2 Basic Clinical Characteristics of UU-Positive and UU-Negative Neonates
Table 3 Gestational Age and Weight Characteristics of Neonates with Ureaplasma urealyticum Infection
Table 4 Analysis of Ureaplasma urealyticum-Infected Neonates with Other Pathogens