Figures & data
Table 1 Inhibition Percentages and CFUs for ORC. The Table Presents the Inhibition and CFUs (Colony-Forming Units) for 33 Bacterial Strains, as Well as C. Albicans. (A) CTL; (B) ORCK; (C) ORCS; (D) ORCF; (E) ORCN
Figure 1 Effects of ORC exposure on 12 strains. Quantitative graphs of 12 bacterial strains exposed to ORC agents including standard, knit, fibril, and non-woven. The controls were non-treated strains. The significance (P value) was referred as * ≤ 0.05, ** ≤ 0.01, and *** ≤ 0.001.
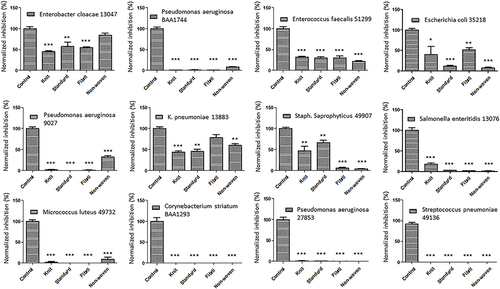
Figure 2 Effects of ORC exposure on 12 strains. Quantitative graphs of 12 bacterial strains exposed to ORC agents including standard, knit, fibril, and non-woven. The controls were non-treated strains. The significance (P value) was referred as ** ≤ 0.01, *** ≤ 0.001.
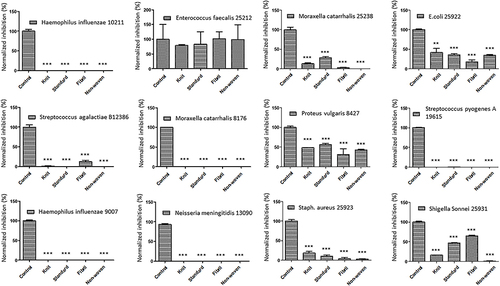
Figure 3 Effects of ORC exposure on 5 strains. Quantitative graphs of 5 bacterial strains exposed to ORC agents including standard, knit, fibril, and non-woven. The controls were non-treated strains. The significance (P value) was referred as * ≤ 0.05, ** ≤ 0.01, and *** ≤ 0.001.
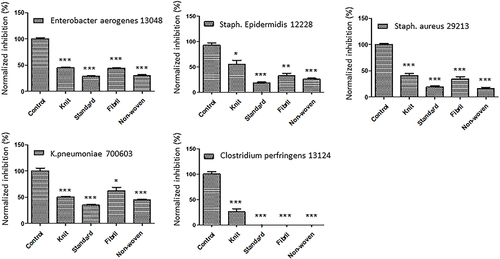
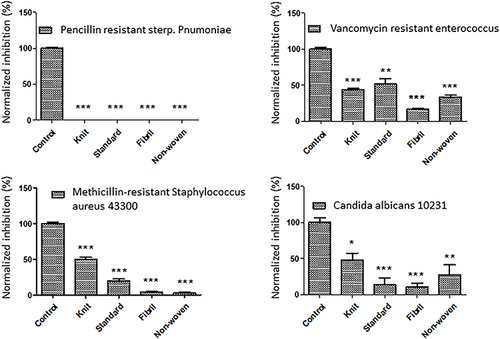
Figure 4 Effects of ORC exposure on four pathogens. Quantitative graphs of four major pathogens (MRSA, VRE, PRSP, and C. albicans) exposed to ORC agents including standard, knit, fibril, and non-woven. The controls were non-treated pathogens. The significance (P value) was referred as * ≤ 0.05, ** ≤ 0.01, and *** ≤ 0.001.