Figures & data
Figure 1 Flow chart of participants included in this analysis.
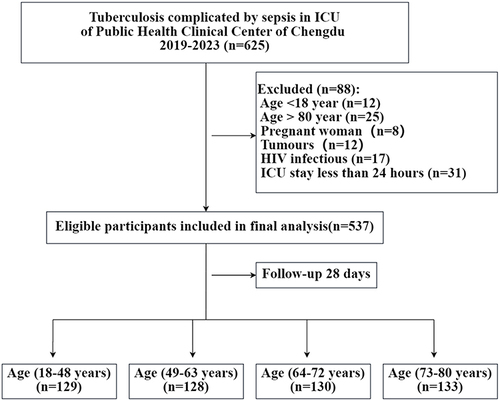
Table 1 Baseline Characteristics of the Study Participants by Age Quartiles
Figure 2 Kaplan-Meier survival curve for 28-day mortality of tuberculosis complicated by sepsis in different age groups.
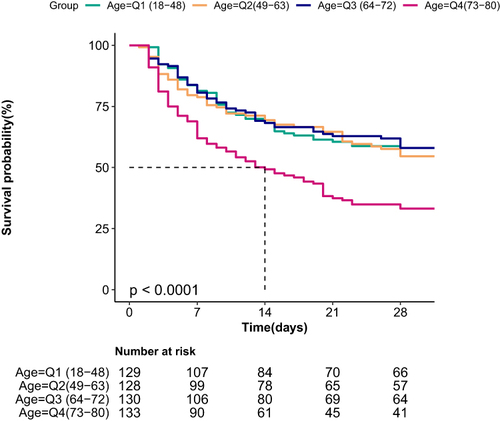
Table 2 Association Between Age and the 28-Day All-Cause Mortality in Tuberculosis Complicated by Sepsis ICU Patients
Table 3 Threshold Effect Analysis of the Association of Age and the 28-Day All-Cause Mortality in Tuberculosis with Sepsis ICU Patients
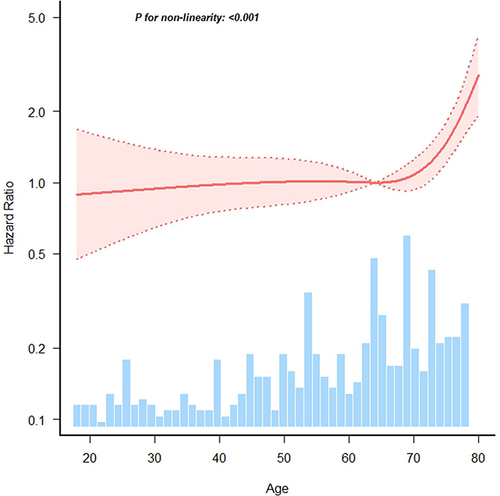
Figure 3 The nonlinear relationship of age and the risk of 28-day mortality fit by Cox proportional hazards regression models with multivariate-adjusted RCS analyses.
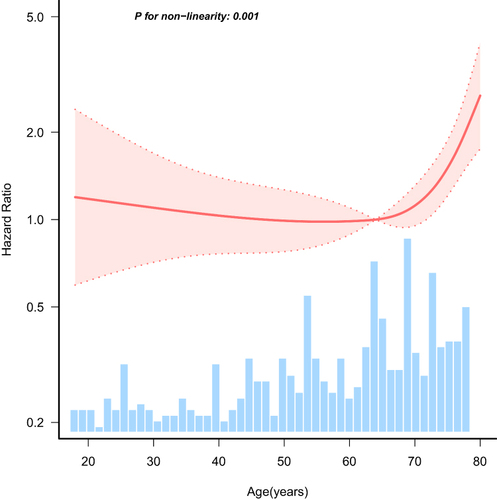
Figure 4 The relationship between age and the 28-day all-cause mortality in the subgroup analysis based on the tuberculosis complicated by sepsis ICU patients.
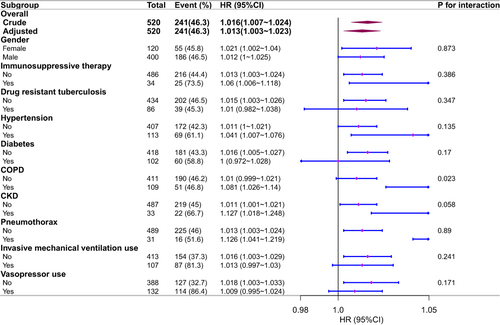
Figure 5 The nonlinear relationship of age and the risk of 28-day mortality fit by Cox proportional hazards regression models with unadjusted RCS analyses.