
Figures & data
Figure 1 The clinical manifestations of the patient. (A) image showing the seborrheic dermatitis-like rash and hair loss on the scalp of patients with initially diagnosed tinea capitis. (B) image showing the lesions represents the same field as A under the Wood lamp. (C and D) images showing the lesions on the scalp of patients with tinea capitis before and after treatment.
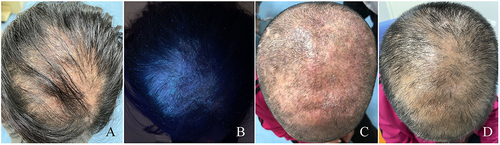
Figure 2 Specimens from the skin lesion were subjected to direct microscopic examination. (A) a representative image of fungal hyphae and spores from the scalp scales on the top of head staining with calcofluor white under fluorescence microscope (original magnification, ×400); (B) represents the same field as A under the light microscopy. (C) a representative image for fungal hyphae and spores from hair in the rash area on the top of the head staining with calcofluor white under fluorescence microscope (original magnification, ×400); (D) represents the same field as C under the light microscope. (E) a representative image of fungal spores from the scalp scales on the occipital staining with calcofluor white under fluorescence microscope (original magnification, ×400); (F) represents the same field as (E) under the light microscopy. (G) a representative image for fungal spores from hair in the rash area on the occipital staining with calcofluor white under fluorescence microscope (original magnification, ×400); (H) represents the same field as G under the light microscope.
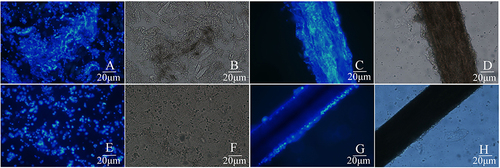
Figure 3 The culture results of patients with tinea capitis. (A and B) the image for direct culture of colonies on Sabouraud’ s Dextrose agar (SDA) after sampling from the scales on the top of the head and occipital, respectively. (C and D) the image for direct culture of colonies on Modified Dixon agar after sampling from the scales on the top of the head and occipital, respectively. (E) a representative image for purification of colony of Microsporum canis after culture on Sabouraud’ s Dextrose agar at 37 °C for 1 week. (F) a representative image for purification of colony of Malassezia globosa after culture on Modified Dixon agar at 37°C for 1 week. (G) a representative image for purification of colony of Malassezia furfur after culture on Modified Dixon agar at 37 °C for 1 week.
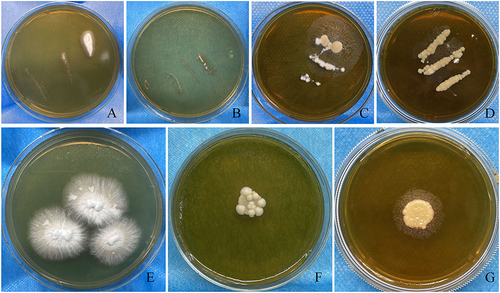
Figure 4 Image showing microscopic observation of Microsporidium canis in the same part of the paddle after 7 days of rice medium culture. (A) Image showing Microsporidium canis under light microscope (original magnification, ×400); (B) Image showing Microsporidium canis staining with calcofluor white under fluorescence microscope (original magnification, ×400); (C) Image showing Microsporidium canis staining with lactophenol cotton lalue under light microscope (original magnification, ×400).
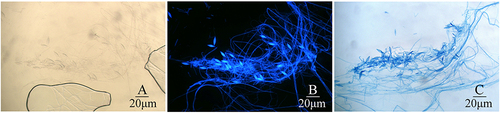
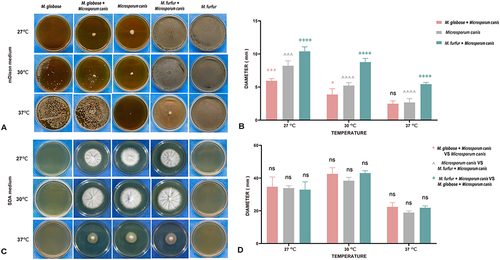
Figure 5 The effect of Malassezia on the growth of Microspora canis in vitro. The experiment included groups: Microspora canis cultured alone, Microspora canis co-cultured with Malassezia globose, and Microspora Canis co-cultured with Malassezia furfur. The strains were inoculated on mDixon agar or Sabouraud dextrose agar (SDA) and incubated at temperatures of 27°C, 30°C, and 37°C for a period of 10 days. The colonies on mDixon agar (A) or SDA (C) were photographed and the diameter of the colonies was measured using the ImageJ software. The diameter of the colonies was measured and recorded on the Y-axis (B and D). To ensure reliability and consistency, the experiment was repeated three times. P is considered significant when <0.05; *P < 0.05; **P < 0.01; ***P < 0.001; ****P < 0.0001 (*Malassezia globosa and Microsporum canis co-culture group VS Microsporum canis group; ^Microsporum canis group VS Malassezia furfur and Microsporum canis co-culture group; +Malassezia furfur and Microsporum canis co-culture group VS Malassezia globosa and Microsporum canis co-culture group).
Data Sharing Statement
All data generated or analyzed during this study are included in this published article.