
Figures & data
Table 1 Comparison of Outcomes in Hematological Patients During Acinetobacter Spp. Bloodstream Infection, Stratified by Acinetobacter Spp. Colonization Status
Figure 1 Kaplan-Meier curves of the 30-day probability of survival in hematological patients with Acinetobacter spp. bloodstream infection, comparing patients with and without previous Acinetobacter spp. colonization.
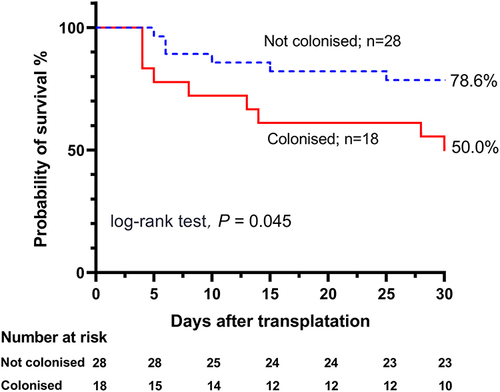
Table 2 The Sequence Types of 21 Carbapenem-Resistant Acinetobacter Spp. Isolates and Four Reference Types Using the Pasteur Multilocus Sequence Typing (MLST) Scheme
Figure 2 The phylogenetic tree of 21 carbapenem-resistant Acinetobacter spp. strains and 4 type strains inferred from a concatenate of the seven alleles used in the Pasteur multilocus sequence typing (MLST) scheme. RT, respiratory tract.
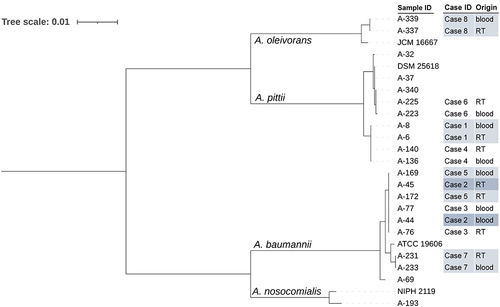
Figure 3 The minimum spanning tree of 21 carbapenem-resistant Acinetobacter spp. (CRA) strains and 4 type strains inferred from a concatenate of the seven alleles used in the Pasteur multilocus sequence typing (MLST) scheme. The sequence types (STs) are indicated by the numbers beside each circle, with the size of each circle proportional to the number of isolates belonging to the same ST type. Branch values indicate the number of loci that differ between adjacent nodes. Grey shading is used to represent the same cluster. Each of the eight pairs of respiratory-bloodstream CRA strains had an identical MLST pattern or was grouped into a clonal complex.
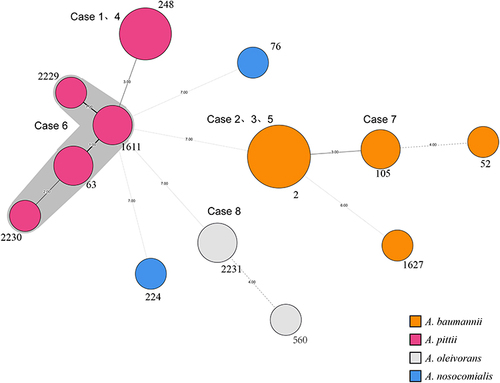
Figure 4 The phylogenetic tree of 21 carbapenem-resistant Acinetobacter spp. strains based on single nucleotide polymorphisms between each strain and strain A-169 by maximum likelihood method. RT, respiratory tract.
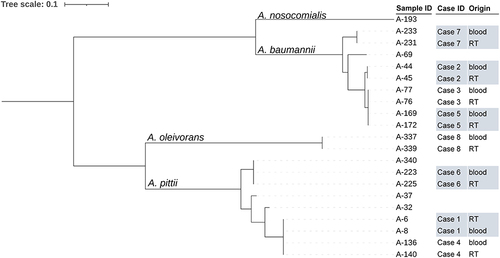
Figure 5 (A) The genic and intergenic single nucleotide polymorphisms (SNPs) identified during within-host evolution. (B) Function class of genes with all SNPs based on the Clusters of Orthologous Groups of proteins (COG).
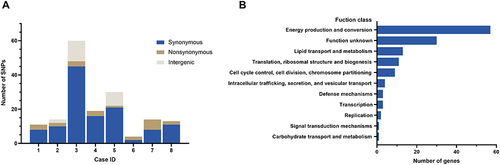
Table 3 Non-Synonymous Genic Single Nucleotide Polymorphisms (SNPs) Found from Respiratory Tract Carriage to Bloodstream Infection in Eight Patients with Carbapenem-Resistant Acinetobacter Spp.