
Figures & data
Figure 1 Workflow of the study.
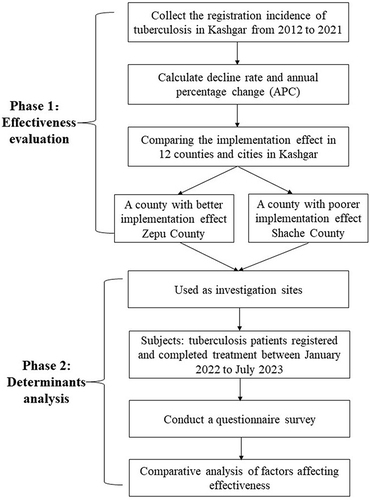
Table 1 Temporal Distribution of PTB Registered Incidence in Kashgar Prefecture, 2012–2021
Figure 2 Temporal trends in registered incidence in Kashgar Prefecture.
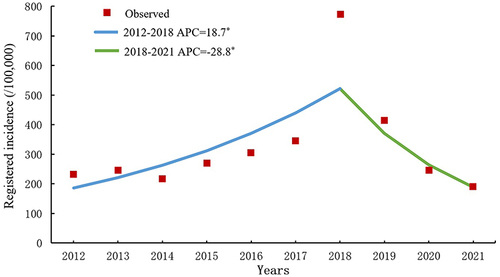
Table 2 Temporal Distribution of PTB Registered Incidence in Counties and Cities of Kashgar Prefecture, 2012–2021
Figure 3 Decline rate of registered incidence before and after the implementation of the policy in the counties and cities of Kashgar Prefecture.
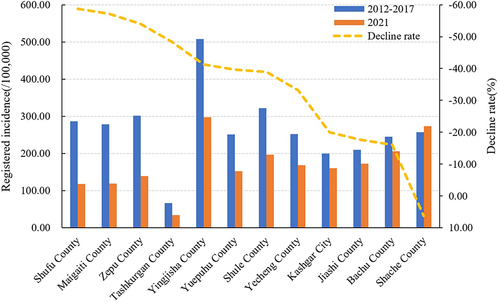
Table 3 Comparison of Individual Information of Survey Subjects in Shache and Zepu Counties n(%)
Table 4 Comparison of Treatment and Outcome for Survey Subjects in Shache and Zepu Counties n (%)
Table 5 Comparison of Knowledge of Tuberculosis Treatment Among Survey Subjects in Shache and Zepu Counties n(%)
Table 6 Comparison of Treatment Burden Among Survey Subjects in Shache and Zepu Counties n(%)
Data Sharing Statement
The datasets used and analyzed during the current study are not publicly available, but they are available from the corresponding author upon reasonable request.