Figures & data
Table 1 Primers Used in This Study
Table 2 MIC of FLC and NBP in Candida Glabrata and Candida Tropicalis
Table 3 Static Antifungal Activity of NBP and FLC
Figure 1 The time-kill curve of NBP on CG19 and CT20((A) CG19; (B) CT20).
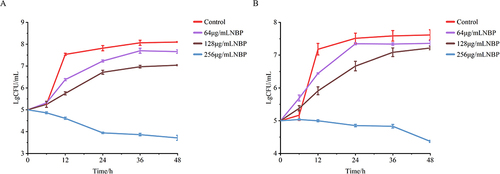
Figure 2 The time-kill curve of NBP and FLC on CG19 and CT20((A) 64 μg·mL−1 NBP+1 μg·mL−1 FLC on CG19; (B) 128 μg·mL−1 NBP+1 μg·mL−1 FLC on CG19; (C) 64 μg·mL−1 NBP+1 μg·mL−1 FLC on CT20; (D) 128 μg·mL−1 NBP+1 μg·mL−1 FLC on CT20).
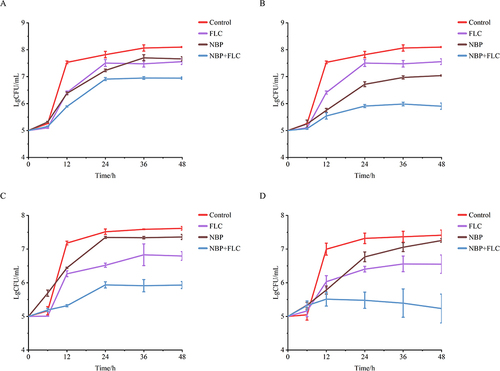
Figure 3 Effect of NBP on the gene expression of the mitochondrial respiratory chain enzyme of CG19(**P<0.01, ***P<0.001, compared to control group).
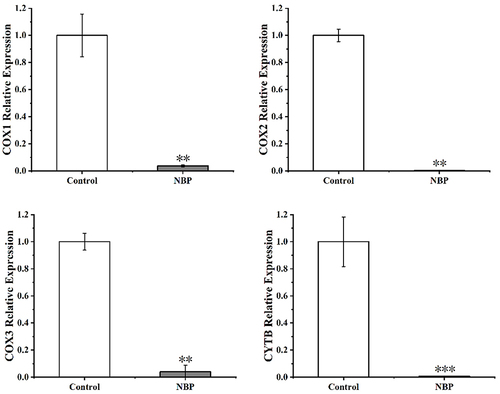
Figure 4 Effect of NBP on the gene expression of the mitochondrial respiratory chain enzyme of CT20(**P<0.01, ***P<0.001, compared to control group).
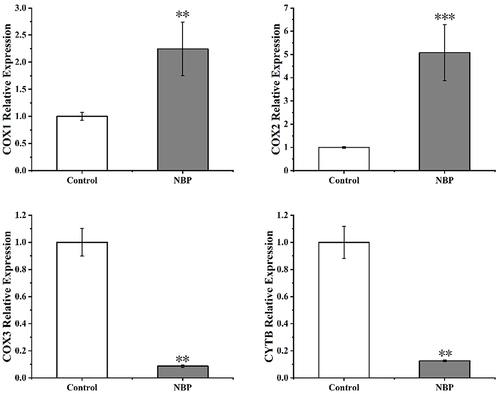
Figure 5 Effect of NBP on the expression of the CDR1 and CDR2 genes of CG19(*P<0.05, **P<0.01, ***P<0.001, compared to the susceptible group; ###P<0.001, compared to the resistance group).
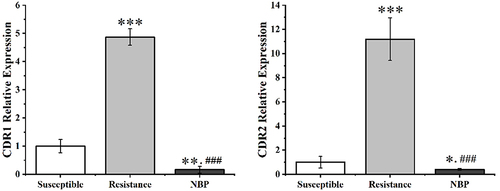
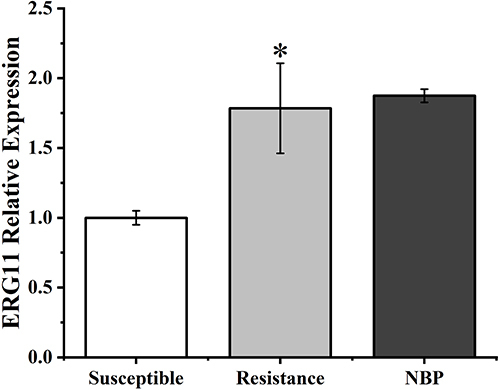
Figure 6 Effect of NBP on the expression of CT20 ERG11 gene (*P<0.05, compared to the susceptible group).